Measuring the engagement of an open source software community

In our Open Source Software Roadmap, we discussed why Bessemer is so excited about the category, the lessons we have learned investing in OSS companies, and the framework we use to evaluate these businesses. Community is one of the six criteria in our open source assessment framework and is an important measure of a project’s health. As part of our research and investment in the space we have analyzed the top 10,000 open source projects on GitHub in an effort to better understand what drives and underpins the best open source projects of the past decade. Here’s what we learned from that analysis.
But first, why community matters
Open source projects are fundamentally driven by input from their communities, even if most contributors never write a line of code that ends up in the final project. When it comes to actually writing the code and directing the project, many open source projects are maintained by a very small group of core developers. But the community still plays other fundamental roles for the project by reporting bugs, sharing feedback on the product roadmap, and submitting feature requests.
Community in open source is tethered to product innovation and adoption.
Ultimately, we think that the community provides the most value for open source projects in their ability to help spread the word about the project organically, lend credibility to the product, and ensure that the project evolves with the needs of its users. Community is tethered to product innovation and adoption, and these are some of the core advantages open source software companies have over their proprietary counterparts. So when we evaluate open source companies, we look to its community engagement to gauge whether it’s strong enough to lend the company a real advantage over competitive solutions.
Which open source software metrics matter
Measuring success for something as qualitative as community is difficult, particularly given all of the different stakeholders and associated metrics.
For our investment purposes at Bessemer, we are most focused on measuring users and contributors, as these are the groups that provide the most insight into the scale of the community. This is why we tend to pay little attention to numbers like Github Stars, which like other vanity metrics, tend to spike in correlation with big press releases, and can be gamed since they are not as reflective of continual engagement.
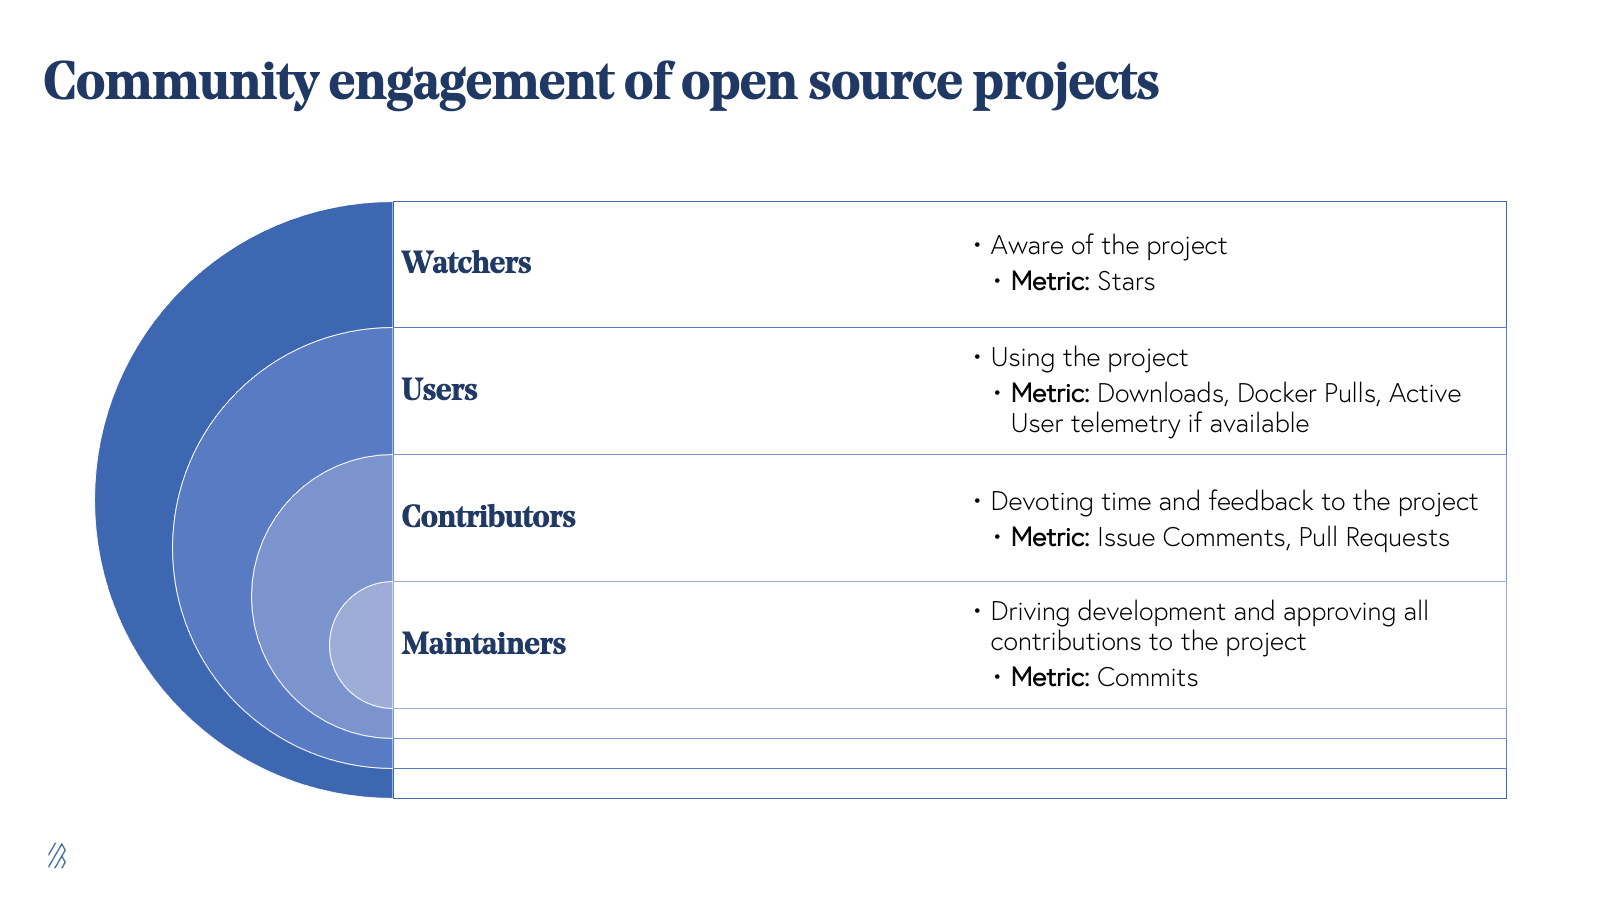
Users and Contributors represent the groups who are actively engaged with the project and rely on it, but given the limited telemetry that most projects have on their users, true active users are notoriously difficult to measure. Contributors on the other hand, only represent a small subset of users. Still, they are much easier to measure. This subset of users tends to demonstrate deeper engagement with the project by devoting time to providing feedback in the form of issue comments, or occasionally contributing code to the project. We do not use the number of contributors to measure how much development capacity the project has. Instead, we use it as a proxy indicator for how much adoption the project is seeing.
Our North Star metric for a project is unique monthly contributor activity.
Contributor is a bit of an ambiguous term from project to project. For the sake of benchmarking, we define it as any user that has created a Github Issue or Issue Comment, or logged a Pull Request or Commit in a given month. Our definition of Contributor is broader than most, considering many only count developers whose commits have been merged into a project. However, to measure community engagement, we think a broader definition is more helpful. While we track many other open source data points, our North Star metric is a project's unique monthly contributor activity.
What best-in-class engagement looks like
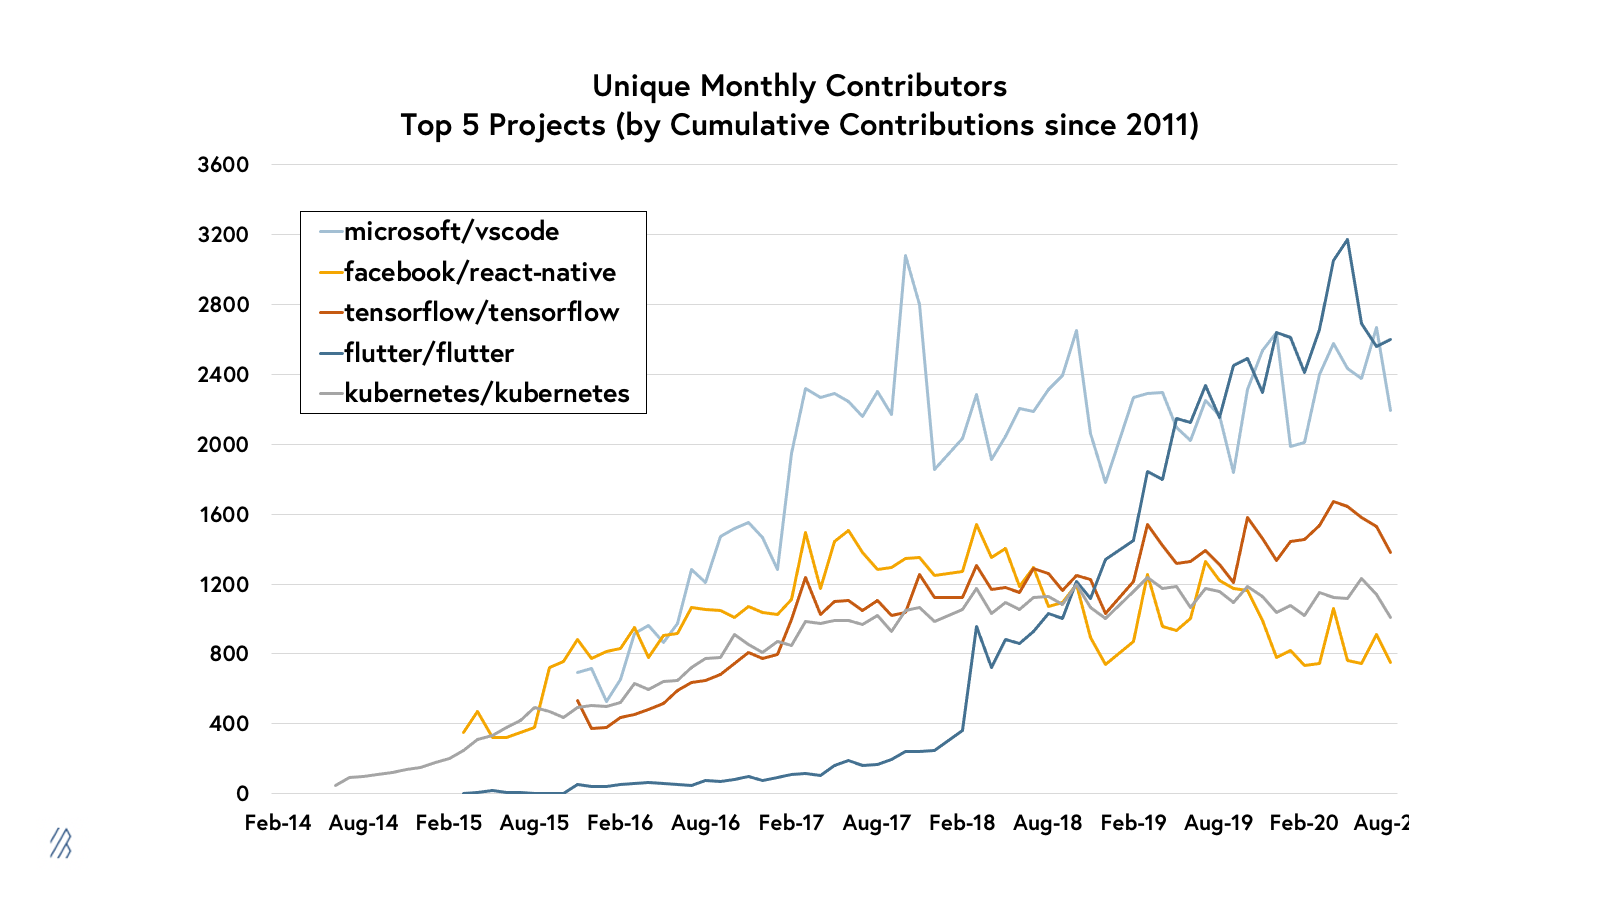
It’s impossible to discuss the largest OSS communities without running into projects from the tech giants. The top five open source projects of all time have come from Google, Microsoft and Facebook. These projects play a fundamental role in modern software development and cloud infrastructure, and they have built incredibly large communities, each reaching over 1,000 unique monthly contributors. Interestingly, each of these projects has become the top one or two most popular technologies in their respective categories, including VSCode, the widely used IDE, Kubernetes, the most popular container orchestration platform, and React Native and Flutter, the two most popular cross-platform frontend frameworks.
But once we strip out the projects backed by Big Tech companies (which are less relevant benchmarks for independent open source projects for obvious reasons), and focus instead on the top 10 independent projects with affiliated commercial startups, the chart looks very different:
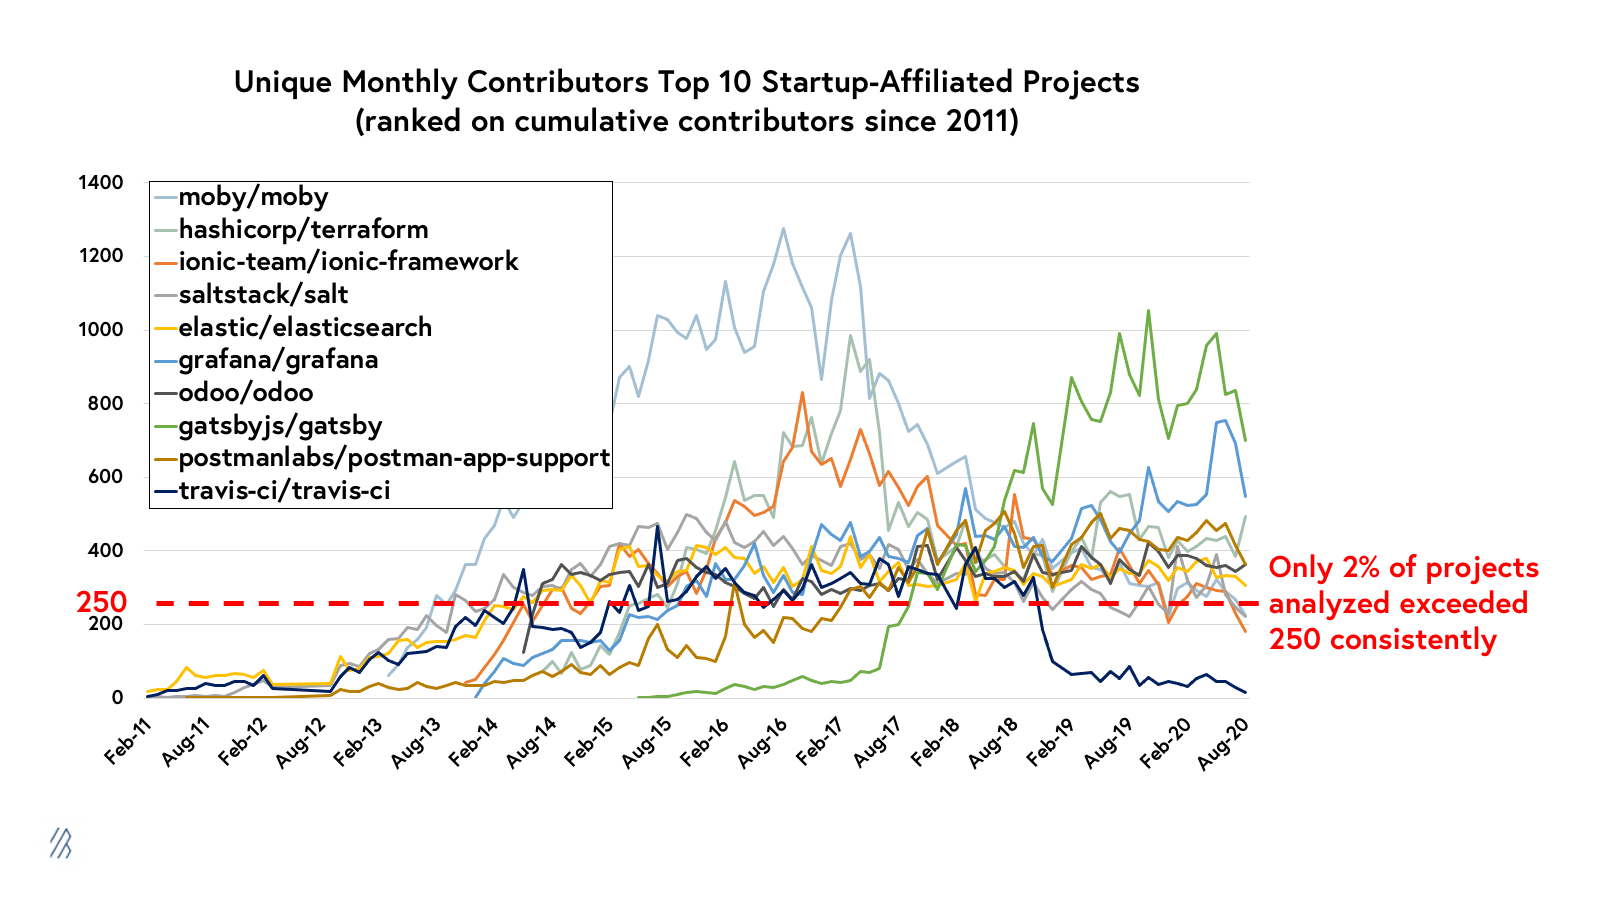
The Moby project (the underlying project behind Docker) and more recently Gatsby, are notable outliers on this chart in terms of peak engagement. But the rest of the projects tend to average between 200 and 600 monthly contributors, which is absolutely best-in-class. For context, out of the top 10,000 projects that we analyzed, less than 5% of those have ever exceeded 250 monthly contributors in a single month, and only 2% of projects ever exceeded 250 contributors consistently (in 6 or more months).
Measuring contributor activity is far from a science, but in our analysis we have identified a few trends:
- Variance by Maturity - Most projects experience strong growth in their early years, before hitting a peak in community activity as the project reaches full maturity, then engagement tends to plateau off. With this in mind, we factor in a project’s age and maturity when evaluating engagement vs. benchmarks.
- Variance by Type - Certain types of projects, such as databases, attract far fewer contributors than other types of projects, like frontend frameworks, which have much larger groups of developers capable of contributing to them. So in order to compare projects apples-to-apples, it is important to segment them by software category to adjust for these variables, as we discuss in more depth below.
- Skew - Contributor activity is skewed tremendously towards the largest projects. While the very largest projects routinely exceed 1,000 contributors per month, very few projects ever reach 100 contributors per month, which is a substantial milestone. Given the massive skew towards the largest projects, we are more focused on whether new projects meet certain thresholds that are relevant for their stage and type.
There are countless other nuances of a project that can impact how likely it is to attract a large contributor base, including how well the project is organized, how welcoming it is to new contributors, and how broad or niche the scope is. But for the purposes of our analysis, we focused on adjusting for one of the largest factors: how many developers are potential users for a given project? For example we know there are far more developers that are capable of contributing to a frontend project like Font Awesome, than there are developers with the expertise to contribute to ElasticSearch. As a result, we expect to see substantially lower contributor counts for the best database projects than for the best frontend projects.
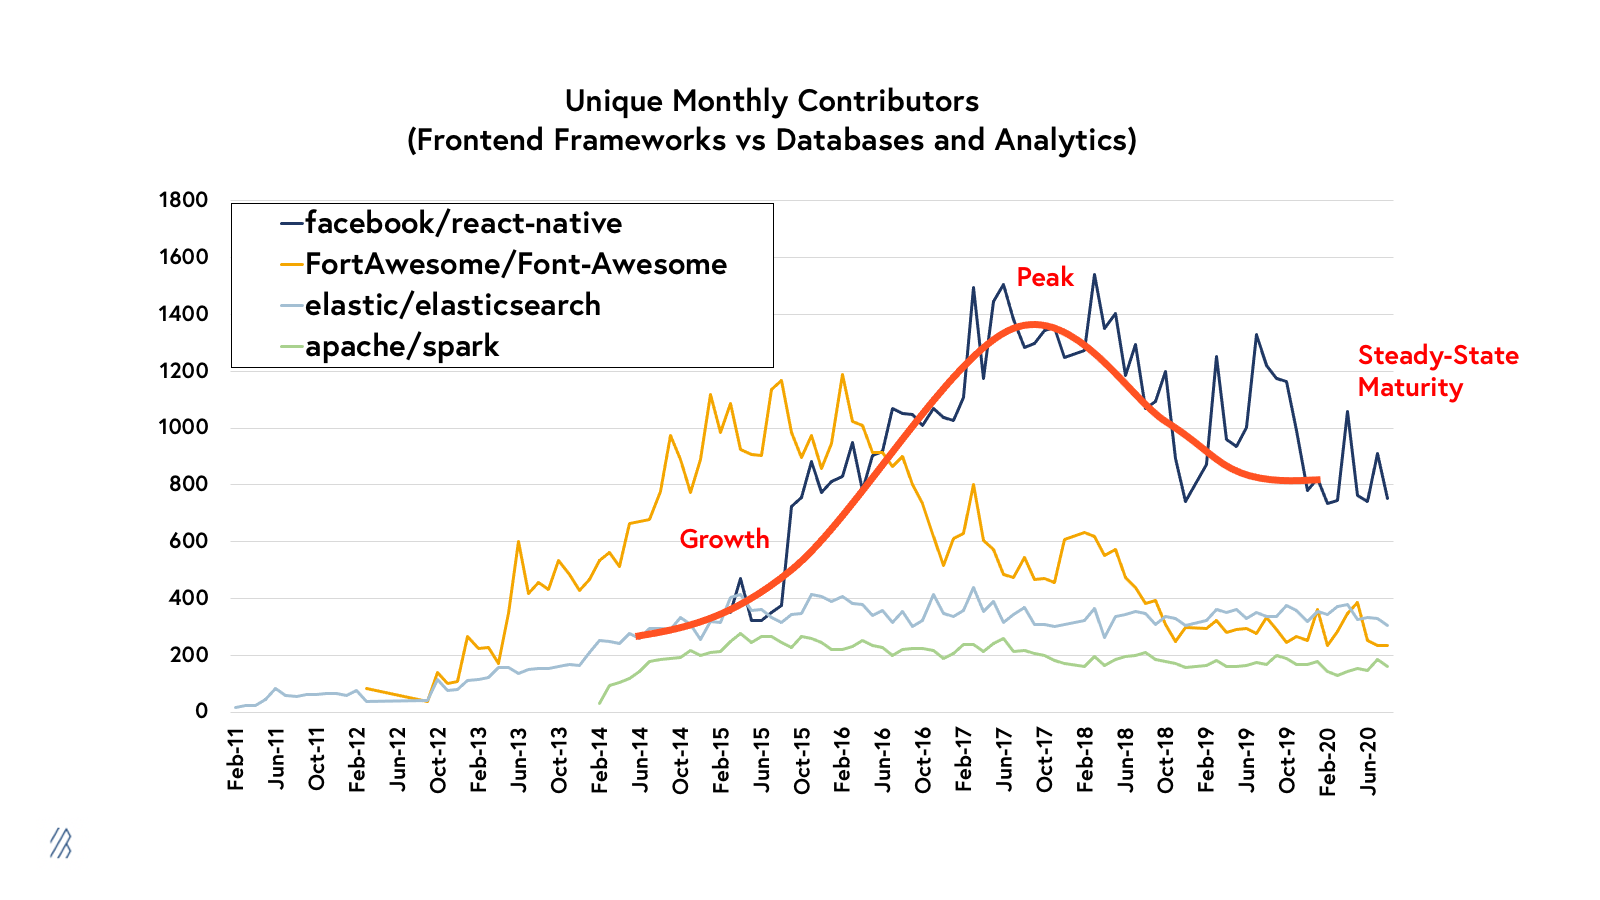
The graph above shows the typical arc of a project’s engagement over time and also illustrates the difference between the scale of popular frontend projects like React Native and Font Awesome, and popular databases and analytics engines like ElasticSearch and Apache Spark.
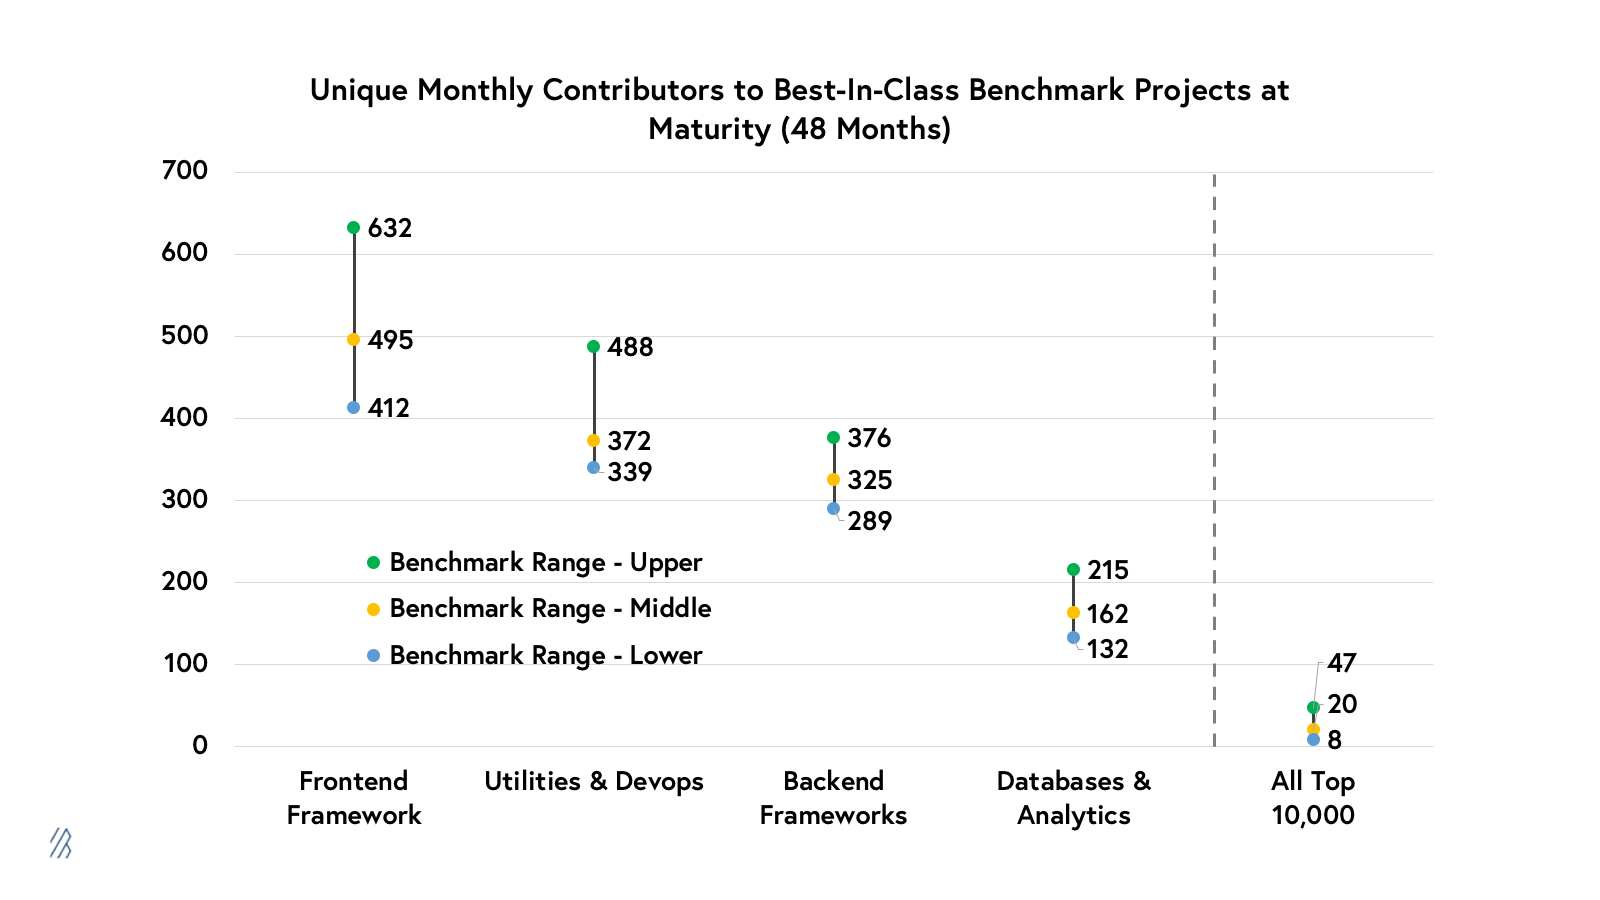
While this is far from a perfect system, we have tried to develop benchmarks that account for the variations across project types by assembling benchmark sets of the top 10 to 20 projects of all time across four major buckets (frontend, backend, devops, and databases) to help us compare projects apples-to-apples against appropriate peer groups. The chart above shows the ranges of monthly contributors for these best-in-class projects at their maturity.
Here are a few of our takeaways from this analysis:
- As expected, this chart illustrates the substantial difference in the number of contributors to projects of different categories, with the top front-end projects averaging the highest number of contributors and the top database projects averaging much lower contributor numbers.
- In addition, the chart also highlights how the activity across all of the benchmark ranges dwarfs the average engagement across the rest of the projects we analyzed.
- While we do use these ranges to provide valuable context around how some of the top open source communities in each category have evolved, we do not view these benchmark ranges as hard-and-fast rules that define success.
To put these benchmarks into context we can look at a few current projects, including our portfolio companies Cypress.io and Netdata, to see how some of today’s most popular projects stack up against the relevant benchmarks. (We plan on diving more deeply into these benchmarks in a future post.)
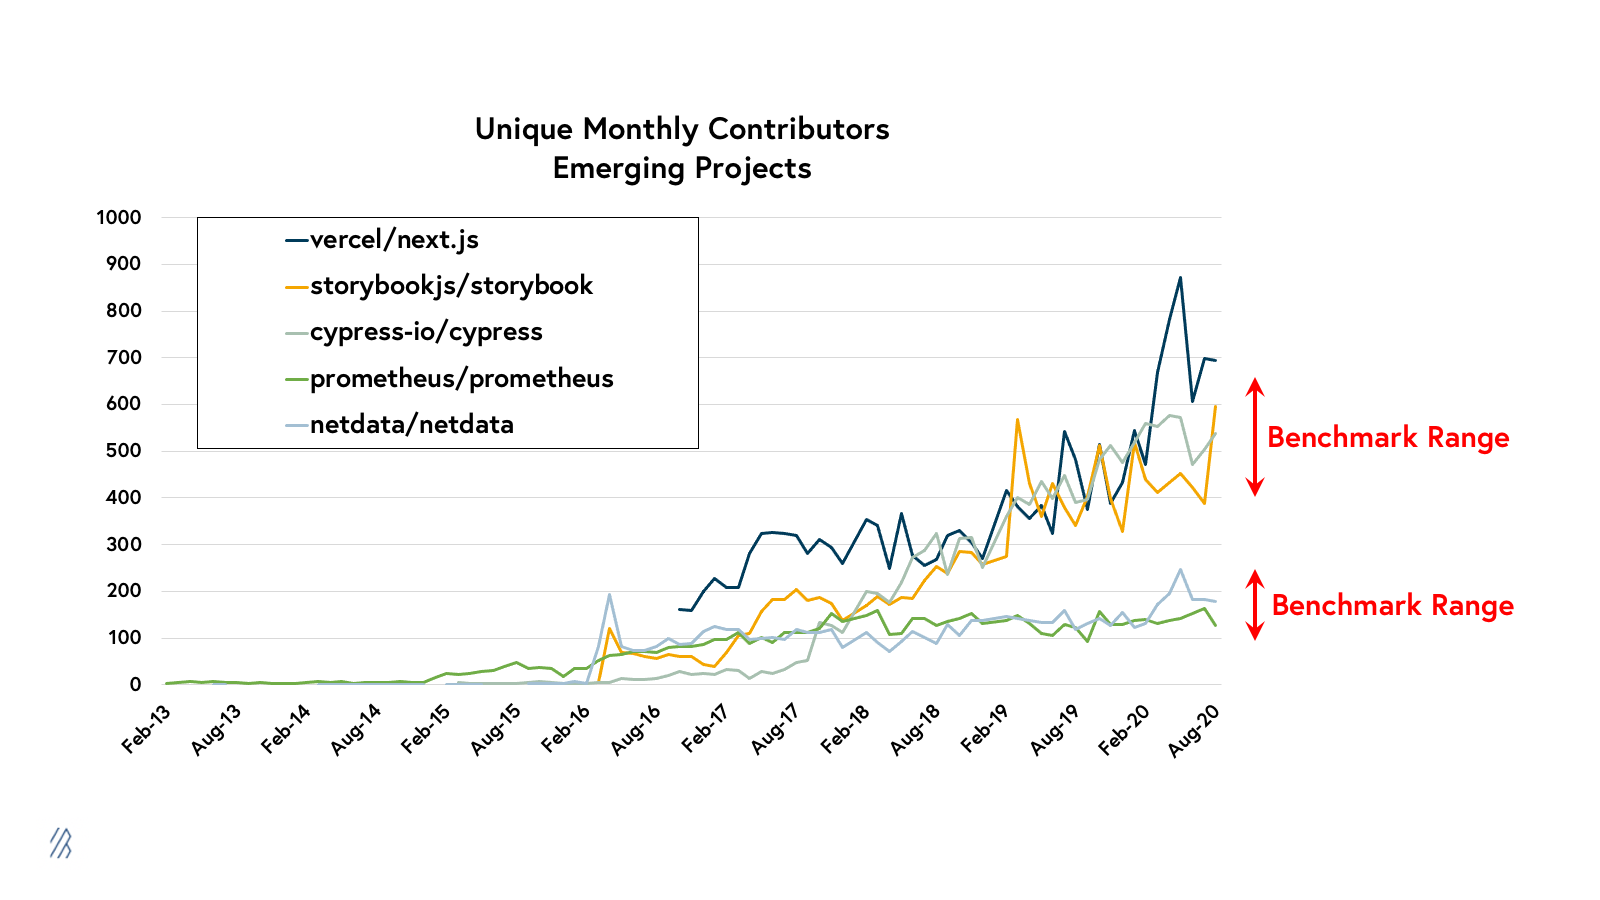
Best-in-class benchmarks can be helpful guideposts, but very few projects will ever achieve benchmark-scale engagement. And frankly, above a certain point, more engagement is not necessarily an indication that a project or company is more likely to be commercially successful.
Most emerging open source projects would be in rare territory if they reached 100 monthly contributors on a consistent basis, and projects that exceed 250 monthly contributors would be approaching the performance of the most active projects of all time. In fact, out of the top 10,000 projects, only 2% have reached 250 monthly contributors in 6 or more months.
There are undoubtedly many more characteristics of open source communities, like the quality and consistency of contributor activity, that are harder to quantify but are equally important to consider. We know that these contributor metrics only tell one part of the story. Although, as investors, we think companies founded on top of strong open source communities have an unfair advantage over their competition, making us even more eager to back companies with this community tailwind.
The future of software is community driven
We are still in the early days of software development becoming increasingly community driven, and the line between commercial and open source software continues to blur. We expect more and more companies will open-source their core technologies—for the mutual benefit that open source provides to both the community and the company—and focus on monetizing only a small portion of their user base. As we continue to invest in these companies at Bessemer, our study on open source metrics will grow and evolve as we incorporate additional data sources into our analysis and better refine our metrics. If you have any input on the research we are conducting regarding these community metrics, or if you are building an open source project or company, please reach out to Amit Karp (karp@bvp.com), Ethan Kurzweil (ethan@bvp.com), Michael Droesch (mdroesch@bvp.com), or Ariel Sterman (asterman@bvp.com).
Note: For our analysis we have focused on Github activity, since this generally captures all code contribution activity and most of the issue tracking for open source projects that are hosted on the platform. However, we recommend project creators and company founders track these numbers across all of the platforms where their contributors exist, as OSS communities are increasingly spreading across multiple platforms (Github, Slack, Gitter, Discord, etc), and may be tracking issues or fielding support tickets on other platforms even if the code is still managed on Github.