Key trends and opportunities defining the next wave of BI and data analytics software
Data is becoming more complex in terms of volume, variety, velocity, and veracity, and the tools that help people and businesses gain value from data are on the precipice of change

Business intelligence (BI) and data analytics is by no means a new category. We live in a world where organizations of all sizes leverage data as a powerful competitive advantage to make informed operational decisions. In fact, Bessemer has been a staunch believer in this category of tools for several years since our investments in companies such as Simply Measured (acquired by Sprout Social in 2017), Sisense, and Periscope Data (acquired by Sisense in 2019). Many notable incumbents, such as Tableau, currently offer broad tools to collect and process data with the goal of gleaning actionable insights. But recently, we have noticed two key trends driving evolution within the BI & data analytics stack:
-
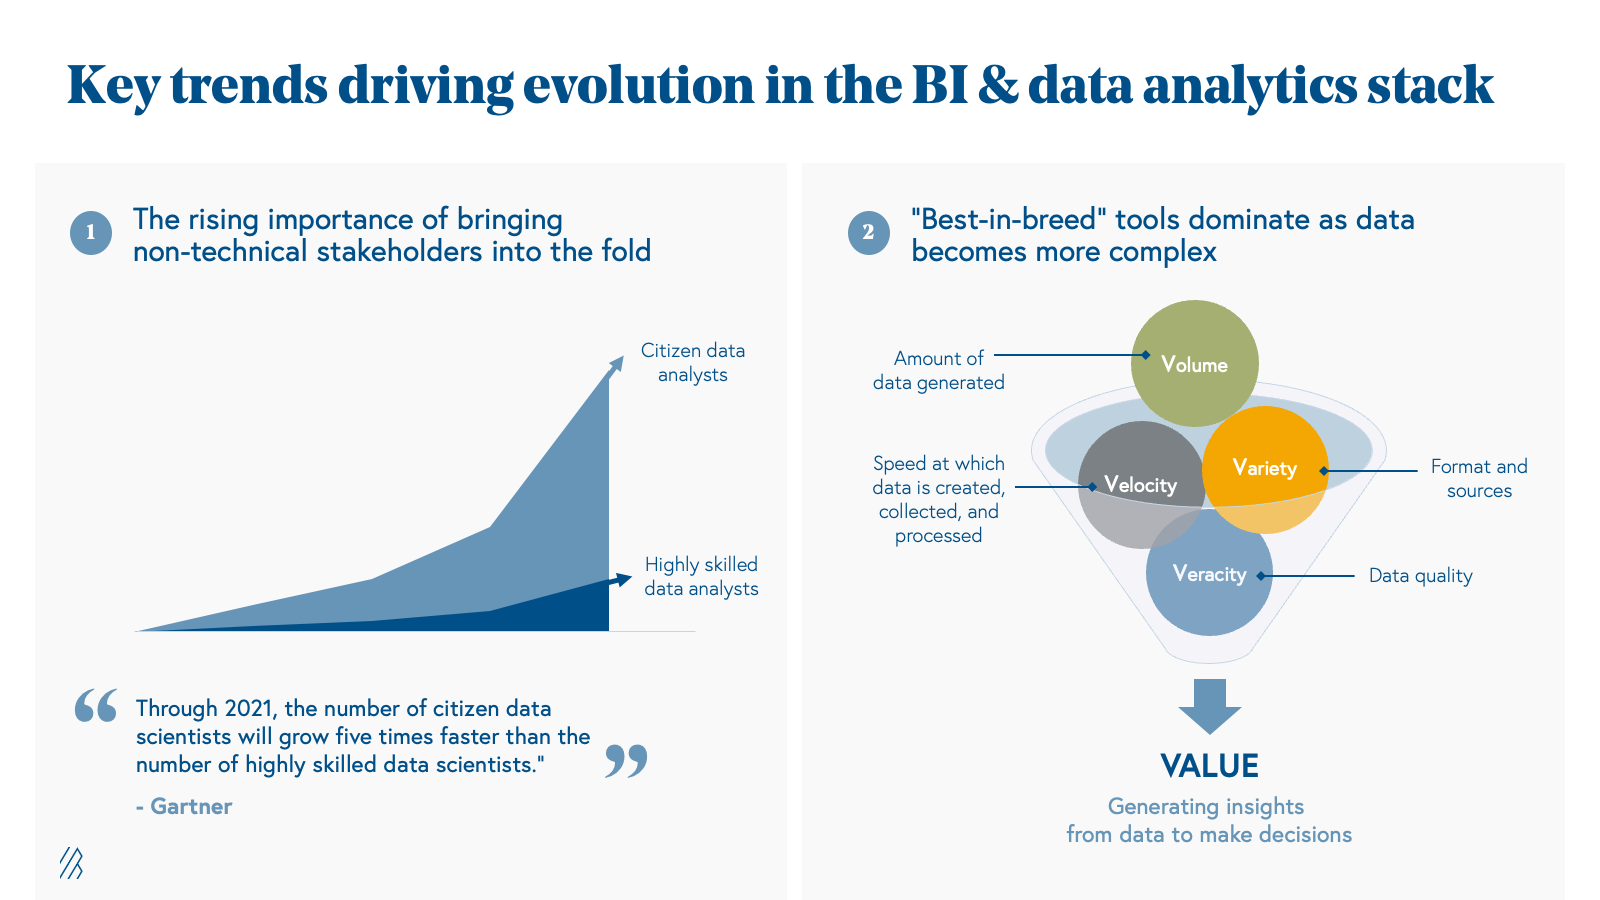
The rising importance of bringing non-technical stakeholders into the fold
Up until recently, many analytics tools were limited to the realm of highly-skilled “data experts” who had the technical knowledge to manipulate and understand big data. However, the latest research predicts the number of citizen data scientists will grow five times faster than the number of highly skilled data scientists. Embracing this prediction, we’ve observed that solutions are not only serving sophisticated, deep data experts but they’re also expanding their features to cater to non-technical professionals and citizen data scientists.
For example, separate from horizontal solutions such as Superset, Hex, Metabase, Streamlit, and Plotly that focus primarily on visualization, we’ve noticed that the new wave of modern BI and data analytics tools are building in visualization layers directly on top of their querying and data layer to bring new data professionals into the fold. Such features are becoming table stakes and not just “nice-to-have” add-ons.
-
“Best-in-breed” tools dominate as data becomes more complex
Generating useful insights from data is much easier said than done, since it requires navigation around a multitude of data characteristics, including:
- Volume: The sheer amount of data generated. In recent years, it is estimated that 2.5 quintillion bytes of data are produced every day. According to a study by Splunk, most businesses and IT managers believe that the volume of accessible data will increase by more than five times in the next five years.
- Variety: The different formats of data, such as structured, unstructured, and semi-structured. There are also different sources of data, which have proliferated in recent years given the growth in adoption and digital transformation of software amongst enterprises.
- Velocity: The speed at which data is created, collected, and processed including through means such as batch and stream processing. Data is now available to be processed in real-time and actions can be taken immediately.
-
Veracity: The quality, accuracy, and consistency of data which dictates how reliable and valuable the data actually is. Veracity depends on many factors such as where and how the data was collected.
Driven by market tailwinds, data complexity around these four Vs is becoming more and more pronounced. As a result, organizations are not only demanding more specialization based on functional areas or industry nuances to solve specific data problems, but also seeking out solutions that help them achieve key business objectives around factors such as infrastructure cost or query time performance. In response, we’ve seen a new wave of modern BI and data analytics software emerge, each offering a “best-in-breed” approach and philosophy optimized for unique use cases.
Against this backdrop of escalating data complexity and the entry of new user archetypes, we delve into the six areas of specialization defining the next wave of modern BI and data analytics software.
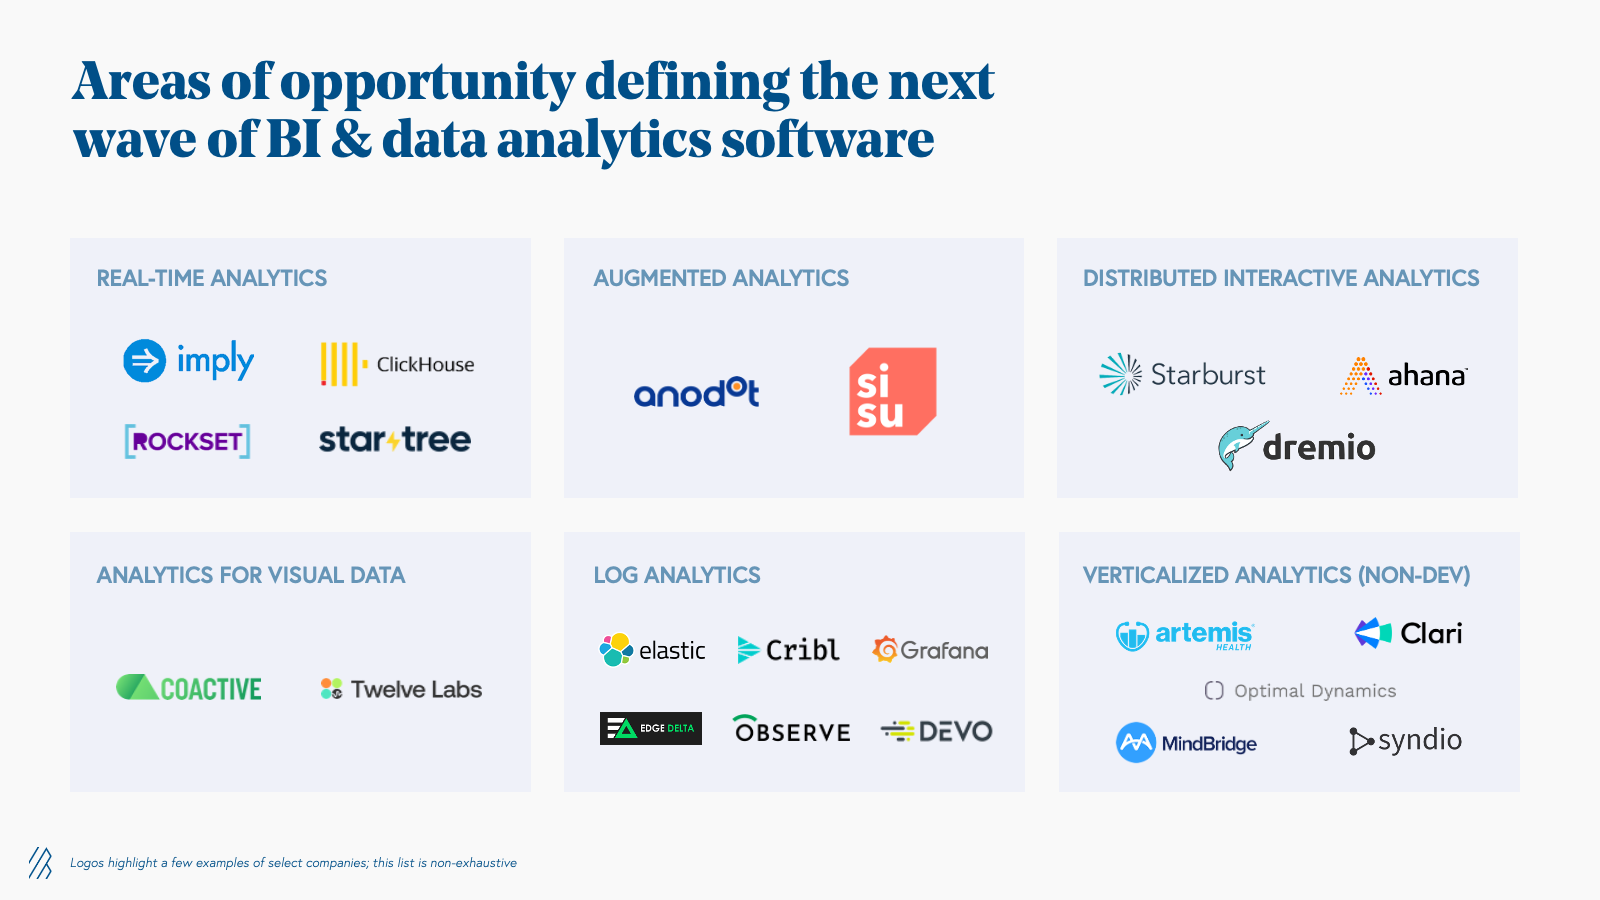
1. Real-time analytics
The speed at which companies need to process incoming data is becoming more and more rapid with the accelerating velocity of big data. Whether it is a business intelligence use case such as a bank needing to take immediate action while monitoring transaction activity and identifying fraud, or an operational intelligence use case such as a network company leveraging telemetry data to understand saturation points and get alerts when services are down, running analytics speedily is crucial for companies to maintaining their competitive advantage.
OLAP databases, such as Apache Druid (managed cloud product by Imply), Apache Pinot (managed cloud product by Startree), Rockset, and ClickHouse (managed cloud product by companies such as Altinity), which provide a metadata store for schemas and query capabilities, are optimized for these use cases as they are able to query real time data as soon as it becomes available, as well as query historical data with low latency. This unlocks the ability for organizations to execute rapid, high-volume query capabilities, which is something that traditional data warehouses can’t handle as effectively.
2. Augmented analytics
As the volume of data inflows scales massively, it is almost impossible for organizations to hire enough data scientists in lockstep, and enterprises are increasingly relying on automated processes to help them process data without human intervention. This trend has given rise to augmented analytics as a category, an approach that leverages machine learning and natural-language generation to surface automated insights. Companies such as Anodot and Sisu use this approach to look for patterns in data and automate analysis processes typically done by a human specialist. Each of these companies have built-in visualization and reporting capabilities to make it easy for non-technical stakeholders within the organization to interpret the data.
3. Distributed interactive analytics
With the variety of big data becoming more heterogeneous, some organizations want maximum flexibility in their analytics solution to allow for querying of different data sources, types, and formats in a unified way. By offering an architecture with true separation of data storage and compute, distributed SQL query engines such as Presto and Trino are optimized for these use cases by allowing for batch processing and querying of data where it lives—for example in S3, relational databases, or even proprietary data stores. Companies like Ahana, Dremio, and Starburst offer managed cloud products on top of such SQL query engines. A single query from these solutions can combine data from multiple sources, allowing for federated analytics across an entire organization, rather than needing to move around massive amounts of data and run multiple queries.
4. Analytics for visual data
According to multiple analysts including Deloitte and IDC, unstructured data, such as video and audio files, accounts for 80% of enterprise data. This form of data is more challenging to interpret compared to structured data, given it is not naturally organized in searchable format (like a pre-set schema), and does not adhere to conventional data models.
With a large majority of enterprise data being unstructured, this is often a massive, under-tapped resource at companies, especially in industries with a high amount of visual data such as in medical imaging or law enforcement. Traditionally, visual data search has relied on manually added tags or descriptions, either through annotation services or tech-enabled solutions automating key parts of data labeling processes. In a new wave, ground-breaking companies are applying pioneering AI and deep learning techniques to enable visual data to be searched, summarized, and understood more intuitively and accurately. Examples include Coactive.ai and Twelve Labs that are revolutionizing how insights are unlocked from visual data through multimodal understanding with neural networks, as well as companies focused on improving the quality of underlying visual data for models using data-centric AI and graph analytics.
5. Log analytics
Many companies that have undergone digital transformation now receive a significant amount of data recorded in logs from events captured from a computer, network, or operating system. Logs are a valuable library of insights since they can provide a wealth of information from user behavior patterns to identifying security issues to application performance monitoring. Distributed search indexes such as ElasticSearch paired with a querying and visualization tool such as Kibana or Grafana’s Loki can help companies to make sense of log data by enabling storage, search, and analysis of unstructured text data. Other examples of log observability tools include the likes of Cribl, Devo, Edge Delta, and Observe.
6. Verticalized analytics focused on non-developer stakeholders
Many of the case examples we’ve highlighted in this piece are developer-focused, but in keeping in mind the tailwind of increasing democratization in this space, we recognize and celebrate that there is a rising crop of highly verticalized BI and analytics tools that focus on empowering non-developer stakeholders in enterprises. These tools span many different industries; here are some select examples:
- Artemis Health, a health benefits analytics platform enabling benefits teams to quantify the impact of their programs and drive their benefits strategy
- Clari, Revenue Ops platform providing insights around pipeline management and account engagement to boost the efficiency of go-to-market teams
- Optimal Dynamics, a logistics planning platform helping trucking carriers optimize their networks and improve operational decision-making
- Mindbridge, analytics software for financial reporting to surface anomalies, incorrect data, and fraud
- Syndio, an workplace equity HR platform that aggregates and analyzes compensation data to help companies identify and resolve pay gaps due to gender, race, and ethnicity
BI and data analytics software drive value—the most important “V” of big data
Ultimately, as data continues to grow in volume, variety, and velocity, perhaps the most important attribute of big data is how much value companies can derive from their repositories of data. As companies continually seek to leverage data as a differentiator, BI and data analytics software have become critical infrastructure for all companies big and small as they lean on these tools to help derive insights and make informed decisions based on their data. As highlighted, we expect to see more evolution toward democratization and specialization within these tools in the coming years.
But if we were to take a step back, the evolution of BI and data analytics software has existed in service of one key task: answer pressing questions. What happened? Who took action? When or where did an action occur? How did this impact something else? As entrepreneurs build more sophisticated solutions to meet the needs of a data-rich world, organizations are better equipped to learn why certain trends emerge and how to improve future outcomes. And as a result, the path ahead will be indelibly shaped by the increasingly complex questions we ask our systems.
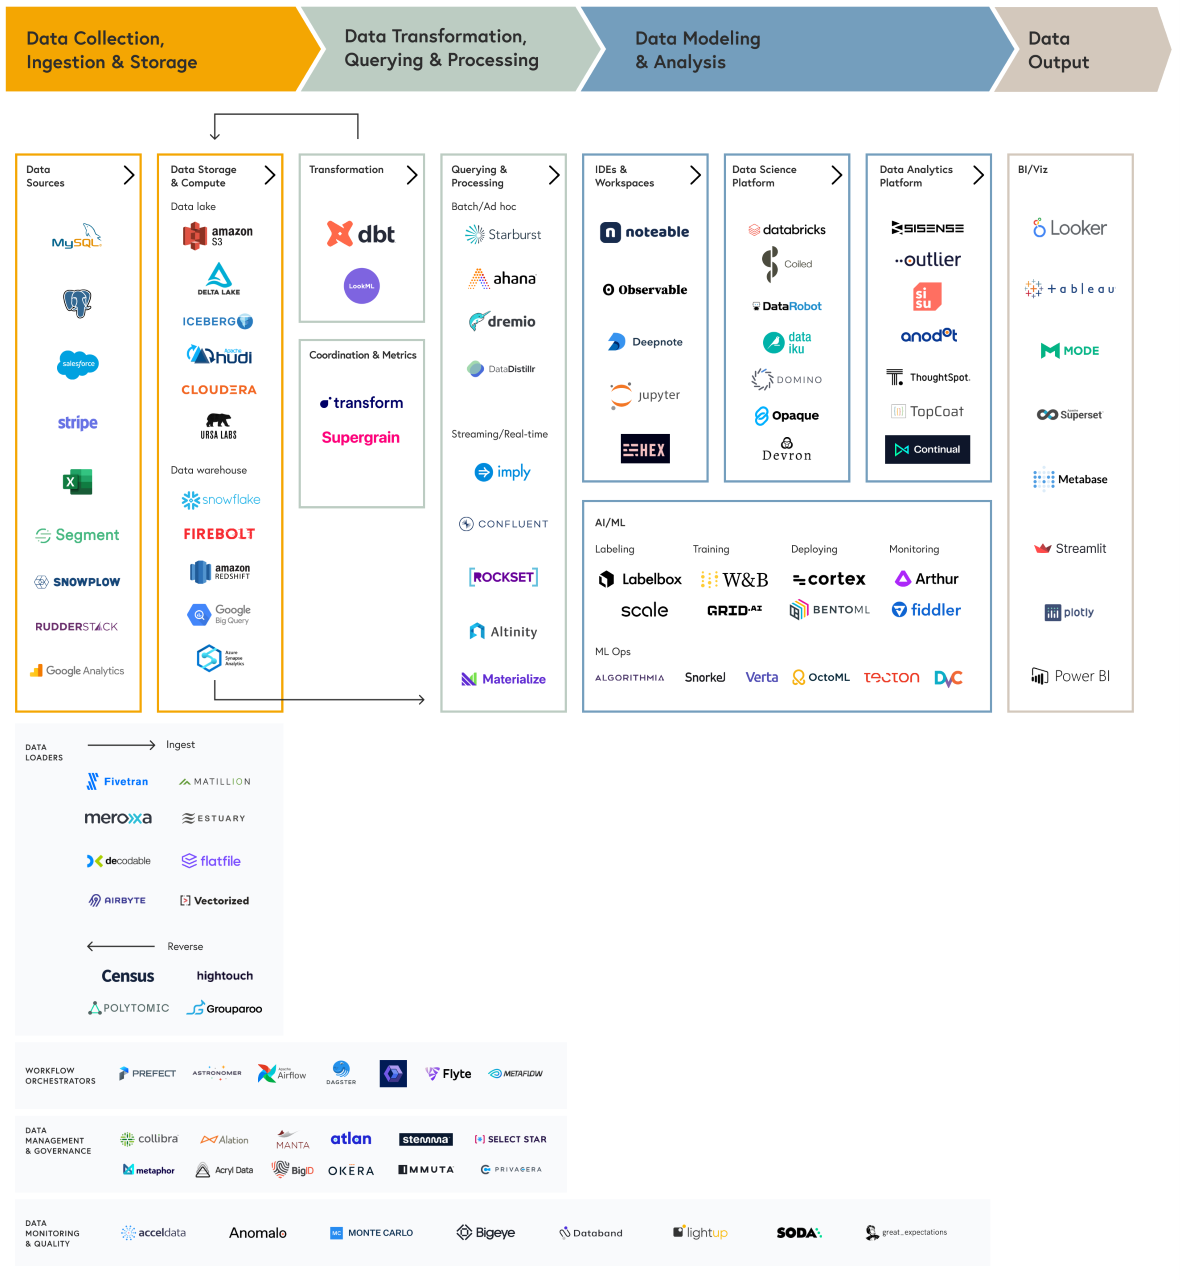
Check out our full data infrastructure roadmap here.
If you’re revolutionizing the BI and data analytics stack, we want to hear from you. Reach out to Ethan Kurzweil, Janelle Teng, Sakib Dadi, Hansae Catlett, or Alexandra Sukin at datainfra@bvp.com.