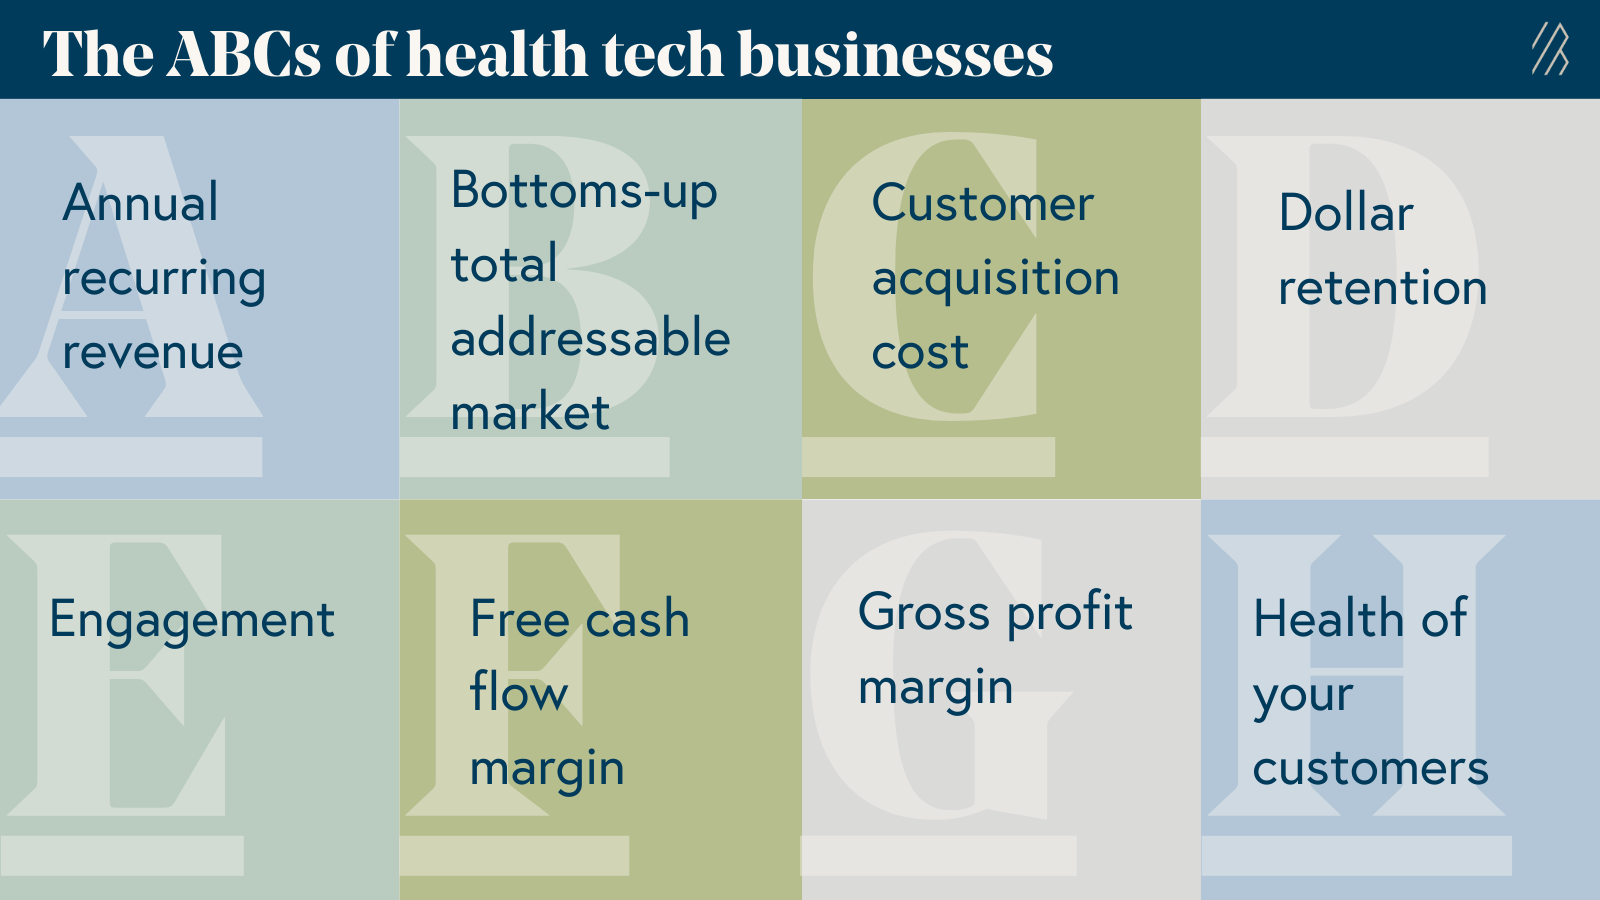
The ABCs of health tech: key metrics to know and grow your business
Definitions for the eight types of performance indicators you should use to measure the strength of your health tech business.

To grow a leading health tech business, it’s important to keep an eye on measures of financial and clinical success. In the same way that the performance of software-as-a-service (SaaS) businesses have industry-specific metrics, we think that healthcare businesses should, too. As a follow-up to our study of 50 private and public health tech companies, we’re providing definitions and formulas for the business metrics all healthcare founders need to know and monitor.
Annual recurring and run-rate revenue
Annual recurring revenue (ARR) growth is a metric that all venture capital investors have their eyes on because it’s the purest view of how fast the business is growing. ARR is defined as the sum of all recurring subscription revenue that a company has received on an annual basis. It’s important to separate ARR from services revenue, which oftentimes isn’t recurring in nature. ARR is a much simpler metric for healthcare SaaS than it is for tech-enabled services; however, below we try to make a case for when it makes sense for tech-enabled services to track annual revenue on a run-rate basis which should serve as an ARR metric.

The main sources of ARR tend to differ between business models:
- In healthcare SaaS, recurring revenue typically comes from subscription enterprise deals or fees charged per seat (per user). Many consumption-based software platforms with high gross margins can calculate ARR by multiplying the number of current customers by their existing consumption levels and adjusting those figures for seasonality or other known usage trends.
- In tech-enabled services, the recurring nature of the revenue may vary, so it’s not always appropriate to use a run rate to evaluate the business. For instance, revenue from B2B2C subscriptions, capitations, or per member per month fees can recur each year and thus serve as an ARR metric. It’s important to note that not all tech-enabled services revenue is recurring revenue. For example, revenue from fee-for-service treatments shouldn’t be annualized.
Furthermore, it’s important that companies differentiate between committed and realized recurring revenue:
- Committed ARR (CARR) is recurring revenue that a company has won from sales contracts but is not yet realized or live ARR. CARR is a leading indicator for revenue and CARR growth is often used by investors as a signal of business health and progress. CARR nets out churned and projected churned ARR and is annualized. In tech-enabled services, committed revenue sometimes refers to “go-get revenue” once a company signs a contract with an employer or payer. The committed revenue in this instance is the average revenue per user multiplied by an estimation of how many members could be engaged on each contract.
- Realized ARR refers to revenue that a company collects based on active users or members, multiplied by the average revenue per user. In healthcare SaaS businesses, the lag to collect or “realize” revenue will vary from company to company, depending on implementation requirements, timelines, and contract terms. In tech-enabled services, the delay in collecting revenue requires companies to activate and retain its members.
What does great growth look like if you’re a healthcare SaaS or tech-enabled services company? Our cloud colleagues often say that best-in-class companies triple-triple-double-double-double their top-line from $1 million of ARR onwards, or grow 200%, 200%, 100%, 100%, 100% year-over-year. From early insight into our 50+ company benchmark analysis, we think this is also relevant to both healthcare SaaS and tech-enabled services. However, we hypothesize that the timeframe to get to the first $1M in ARR will differ between healthcare SaaS, tech-enabled services, and traditional cloud businesses because the healthcare go-to-market process entails longer sales cycles, longer implementations, and multiple stakeholders. In addition, we argued that top-line growth is important, but there are many other metrics that you should benchmark against to show the efficiency and scalability of your business.
It’s important to distinguish your total ARR from “net new ARR.” Net new ARR refers to the annual recurring or run-rate revenue your company added over a given period of time. To calculate net new ARR, subtract your ARR number at the beginning of the year from your ARR number at the end of the year. Net new ARR will be a critical input in calculating many of the subsequent metrics.

While ARR offers helpful forward-looking insight, it’s not a substitute for generally accepted accounting principles (GAAP) revenue. For companies approaching an initial public offering (IPO), Wall Street focuses a lot more on GAAP revenue because it’s easier to audit revenue that’s based on an agreed-upon methodology. Determining your GAAP revenue helps analysts make apples-to-apples comparisons between companies in the same sector that have different business models. For younger venture-backed companies, GAAP doesn’t matter as much, but as you scale towards $100M and potentially an IPO, it’s important to also understand what your GAAP revenue looks like, as well as how it differs from ARR and CARR on an absolute dollar basis and a growth basis.
Bottoms-up total addressable market
How you define your market matters: it gives you a better sense of the total addressable market (TAM) today so that you can develop a robust go-to-market strategy, while also acknowledging that the market will change in the future. We encourage founders to not just look at top-down addressable spending for their category, but instead to go through the exercise of building a bottoms-up view of their TAM. To follow a bottoms-up approach to TAM, identify the variables that factor into the volume you’re selling and the prices you’re charging for products and services.
In healthcare SaaS, a bottoms-up TAM calculation may be as simple as the number of potential customers multiplied by the average annual contract value (ACV) for enterprise deals, or the number of potential users multiplied by the average annual revenue per user.

In tech-enabled services, the top-down approach is to estimate the fee-for-service spend in a disease category that is addressable or consumption in the as-is system. The bottoms-up approach is more detailed and specific to your business depending on channels, available population, and engagement estimations.

For a more detailed framework on how to think about market sizing and its implications on reimbursement, regulation, and market growth, read Law 1 of our healthcare laws.
Customer acquisition cost payback
Customer Acquisition Cost (CAC) payback period refers to how long it takes to get a return on your incremental sales and marketing expenses, where CAC is the upfront cost of acquiring a customer. This metric indicates the number of months that it takes you to fully pay back your costs to acquire a customer after accounting for variable expenses to service that customer. We like to calculate this metric on a “gross margin”-adjusted basis.

Healthcare SaaS and tech-enabled services use the same formula to calculate CAC payback, but differ in how much they should spend on sales and marketing to acquire customers. The amount that companies should spend on customer acquisition efforts will depend on the gross margins that make its services and acquisition channels scalable. At tech-enabled B2B2C companies, for example, sales and marketing teams spend some of their budgets on customers who pay for their products and services, like large payers or employers, and other go-to-market dollars on acquiring members who actually use what they offer, like individual employees with relevant health conditions.
To simplify our calculations, we include both B2B and B2C marketing spending for tech-enabled services together. However, we encourage companies to monitor return on investment (ROI) of each channel and category independently.
To help us make apples-to-apples comparisons in our benchmarking exercise, we used historical company financials to calculate all metrics. These include CAC payback––based on total sales and marketing spend, including go-to-market employee salaries––marketing spend, and any platforms or tools used to support sales and marketing activities.
Another way to understand the ROI of your customer acquisition costs is to calculate the customer lifetime value (CLTV) / CAC ratio. CLTV indicates the net profit that a company can generate from a customer throughout the entire duration of the customer relationship, and CAC refers to the upfront cost of acquiring a customer.

Note that it’s difficult to know the true lifetime of a customer with limited churn data. That’s one reason why CLTV and CLTV/CAC ratio metrics are more relevant to later-stage companies.
But early-stage companies can still generate a rough idea of customer lifetime by taking the average churn rate in a year and dividing that into one year. Let’s say a company loses an average of 20% of its customers per year. The assumed lifetime would be five years for an average customer, even if you don’t have five years' worth of data.
Dollar retention
There are two ways to calculate dollar retention: gross dollar retention and net dollar retention. Both metrics are important measures of how successful a business is at keeping its customers on board, and even the payoff from delighting them enough to increase their spending on your platform.

Calculating net dollar revenue retention (NDRR) for SaaS businesses is much more straightforward than it is for tech-enabled services. The simple way to calculate NDRR is based on changes to ARR in a given period of time.
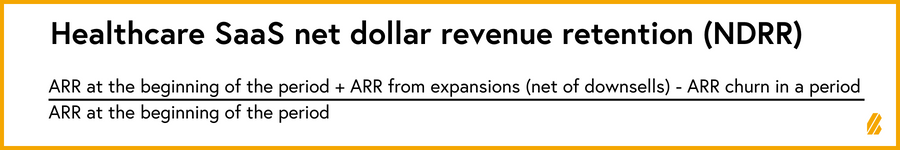
Expansions may include contract price increases or net new seats or members serviced. Churn includes contract expirations, member churn, and cancellations.
In our initial benchmarks piece, we talked about how revenue for tech-enabled services is transactional in nature, but a strong NDRR is a great indicator of how effective a business is at growing its recurring revenues. It’s harder to calculate NDRR for tech-enabled services because oftentimes the user isn’t the customer––for instance, an employer might pay for a telehealth service for its employees to use. We encourage you to use cohort analysis to understand how the revenue from customers in period #1 grows to period #2—cohort analysis is an exercise where you track specific groups of customers that started in a given period and see how their spend and utilization changes over subsequent periods of time. While a specific member may stop using a tech-enabled service, new members will be diagnosed and engaged within the same customer contracts.

Engagement
Engagement is one of the most important leading indicators of success for early-stage companies. Tracking engagement and utilization of a given product or service is equally important for healthcare SaaS and tech-enabled services. However, for tech-enabled services, we encourage founders to track both member and clinician engagement. There are three important metrics to track:
- Activation %, which refers to how many members you’re able to onboard to your service.
- Engagement %, which indicate how many users you have and how often they’re using your product or service in a specific period of time. Engagement metrics vary by product or service. Some are measured on a daily basis (daily active users), while others are measured each week (weekly active users) or month (monthly active users). It’s important to define what engagement metrics are right for your business and then actively track them. Investors use engagement metrics to estimate what actually realized revenue could look like in future years for signed contracts (CARR). When comparing engagement metrics with benchmarks from other companies, it's important to use an apples-to-apples denominator that only includes potential members addressable in your area.
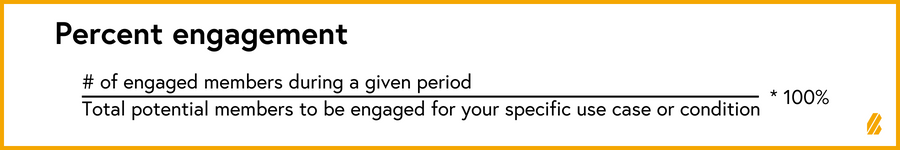
Membership growth: Take membership growth over a given period of time, and subtract churn and incremental activations from new users on the platform. This is a simple percent change calculation based on the net number of members and thus we included it in our benchmarks because it’s standardized across companies that share membership numbers.

Free cash flow margin and cash efficiency
As with any downturn, the recent market volatility has shed light on the importance of cash management for early-stage companies. It’s critical for startups to understand the ROI from every dollar burned, particularly in an environment with a higher cost of capital. To help early-stage companies monitor cash flow, we recommend calculating their net burn rate.

As companies mature, the gold standard for measuring cash flow shifts from net burn rate to free cash flow margin. Free Cash Flow (FCF) is the cash generated after operating and capital expenditures, which adds back non-cash expenses like stock-based compensation. When positive, FCF represents investable dollars that you can re-invest into your business. When negative, the amount of FCF you burn every year will determine your runway.
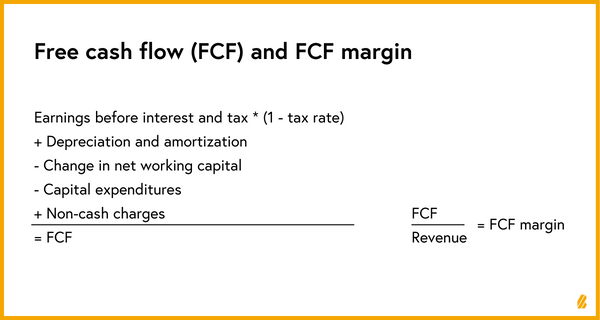
Cash flow metrics are lumpy based on the timing of collections and payables. This is particularly relevant for tech-enabled services. In fee-for-service businesses, collections are often tied to traditional revenue cycles, whereas for value-based care businesses, there are often cash flow delays of 12 to 18 months. That’s because value-based care revenues are contingent upon outcomes, which require time and effort to measure.
For early- stage startups, calculating your cash efficiency score (CES) can help you understand the return on invested capital in a given period, and with strong indicators that your revenue is recurring, correlate to long-term value.

Best-in-class companies have a CES of 1x+ because, by definition, every dollar invested in the business will yield a dollar or more in new ARR; even better is a company where every dollar invested in the business yields a dollar or more in gross margin.
For later-stage companies with $30 million or more in ARR, we suggest two metrics depending on your business model to help find the right balance between growth, unit economics, and profitability.
Healthcare SaaS businesses should aim to achieve the “Rule of 40.” A metric that growth-stage and public investors use to indicate efficient growth, the Rule of 40 is when the combination of your growth rate and profit margin equal or exceed 40%.

For tech-enabled services, we introduced a metric called the scalability score. This metric is similar to the efficiency score, but takes into account the unit economic profile of the business.

Gross profit margin
Gross profit margin is a measure of how much revenue businesses retain after accounting for expenses associated with selling products and services. Gross profit should be the north star of any business, and that’s especially true for tech-enabled services: the gross profit of a tech-enabled services company shows how scalable its business model is, and how its unit economics are improving over time.

In healthcare SaaS, COGS includes web hosting, billing, merchant processing fees, and any third-party revenue share and customer support. In addition to these costs, tech-enabled services should also consider labor costs associated with clinical work, patient appointments, and content delivery as COGS. It’s important to be honest with yourself about what is included in COGS as investors will look into the calculation and often move line items that have been buried “below the gross profit line.” As a CEO, you want to have a true sense of what your COGS are and how much operational leverage your business really provides you.
Health! … your customers' health is driven by both financial and clinical ROI
In our health tech benchmarks article, we studied the financial and operational metrics of 50+ private and public companies to show how top health tech businesses scale. But as important as metrics are for early-stage companies, we have a harder time quantifying and comparing the financial and clinical ROI that a product or service delivers. Both clinical and financial ROI should be calculated from the eye of the customer and help them make buying decisions by comparing how your business stacks up against competitors in the market. But because business and care models vary, there isn’t a universal approach to measuring and reporting outcomes.
The most direct way to track financial ROI for healthcare SaaS businesses is by measuring incremental revenue, or how much additional revenue your customer expects to generate from using your product or service. Reductions in direct or indirect costs, too, can help healthcare SaaS businesses measure their ROI, because of their impact on bottom-line profitability but these costs take longer to realize and attribution of process changes get muddy. We encourage companies to define with their customers upfront how to calculate ROI and meticulously track it over time.
For tech-enabled services, especially those delivering care to patients, clinical ROI is just as important as financial ROI. But it’s hard to make apples-to-apples comparisons of clinical ROI metrics between companies, primarily because clinical endpoints and measurable outcomes vary by specialty and disease severity. Very few early-stage companies invest enough resources in defining and robustly tracking clinical outcomes, and we think that’s a huge mistake: clinical outcomes are arguably the most important measure of the long-term success and sustainability of companies in the healthcare sector.
And not all outcomes in health tech are rigorously measured. Some companies conduct randomized clinical trials, whereas others conduct pilot studies with payers and employers, or publish outcomes with industry and academic thought leaders. As the industry matures, you can get ahead by measuring clinical outcomes with metrics that make it easy for the public to compare you against peer companies.
With the increased saturation of point solutions, customers of both healthcare SaaS and tech-enabled services are demanding proof that the products and services drive improvements in how care is delivered and administered. We hope to better unpack in future articles how to make outcome-tracking a more standardized metric that companies want to showcase equality to their financial performance as they scale. We would love to hear about your methodology and ideas for standardization across the industry.