Scaling to $100 Million
The definitive benchmarking report on how cloud companies grow operationally efficient businesses and scale to $100 million in ARR (and beyond).

As growth investors at Bessemer, we hear the same benchmarking questions over and over from portfolio companies as they mature: What should my gross margin be? How much should I be spending on R&D as a percent of revenue? How does my growth rate compare to peers in the market?
When it comes to building and scaling a cloud business, founders, executives, and board members alike want to know what “typical” and “best-in-class” look like. Leaders, like you, aim to model their businesses around these benchmarks to achieve their goals.
There's a problem, though. Private market financial benchmarks are some of the most elusive financial data points in the world. They're also some of the most helpful. If you’re a cloud startup seeking to emulate the success of companies like Shopify, Procore, and Twilio, understanding how your predecessors grew and achieved key milestones is a critical part of the equation. But not everyone has access to this type of information. Private companies lack reporting requirements that would make their benchmarks known, and backers of private companies hold their portfolio company information close to the chest. Considering these factors, only the highest-flying, venture-backed companies have the opportunity to learn from the stories of the past, leaving other startups at an inherent disadvantage—until now.
"Scaling to $100 Million" is the industry’s definitive benchmarking report for cloud companies looking to scale to new heights. For more than a decade, Bessemer has made over 200 cloud investments and has one of the largest cloud portfolios of any venture firm in the world.* As we share this information with leaders like you, we hope this body of analysis proves to be a valuable resource for what growing your cloud business looks like at every stage.
Takeaways for cloud companies scaling to $100 million
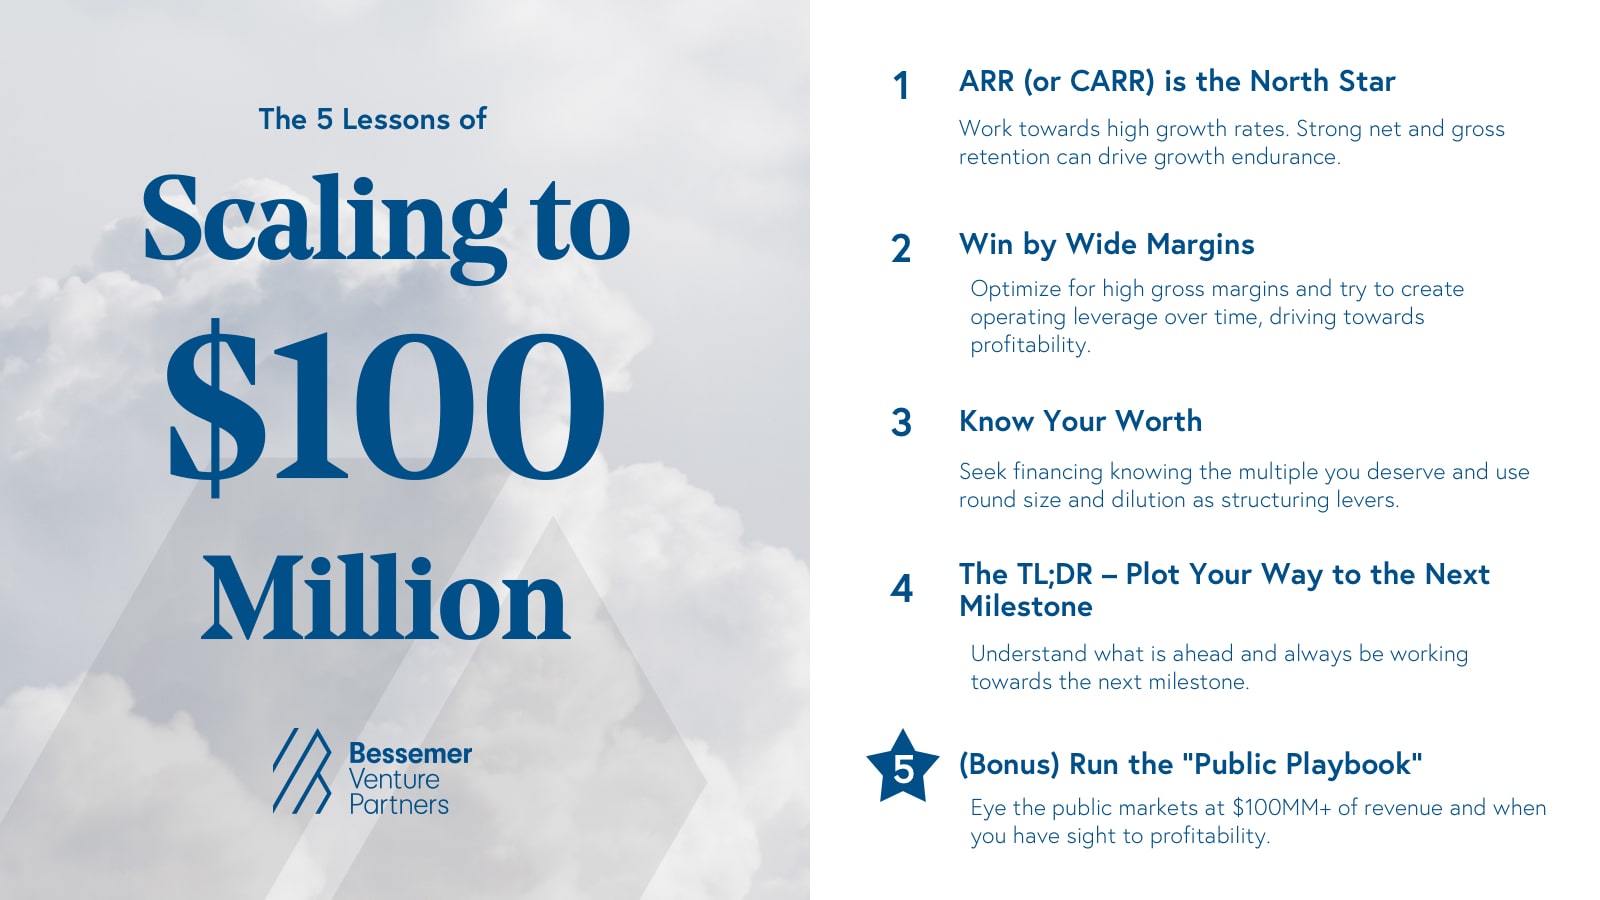
Lesson 1. ARR is the North Star
- Focus on growing ARR (or CARR) as the main metric for success.
- Typical growth: ~200% at $1–10MM ARR, decreasing to 60% over $100MM.
- Expect ~70% growth endurance YoY in the private cloud universe.
- Strong retention: ~85% gross, ~120% net, sustains momentum.
Lesson 2. Win by wide margins
- Aim for 65–70% gross margins over time.
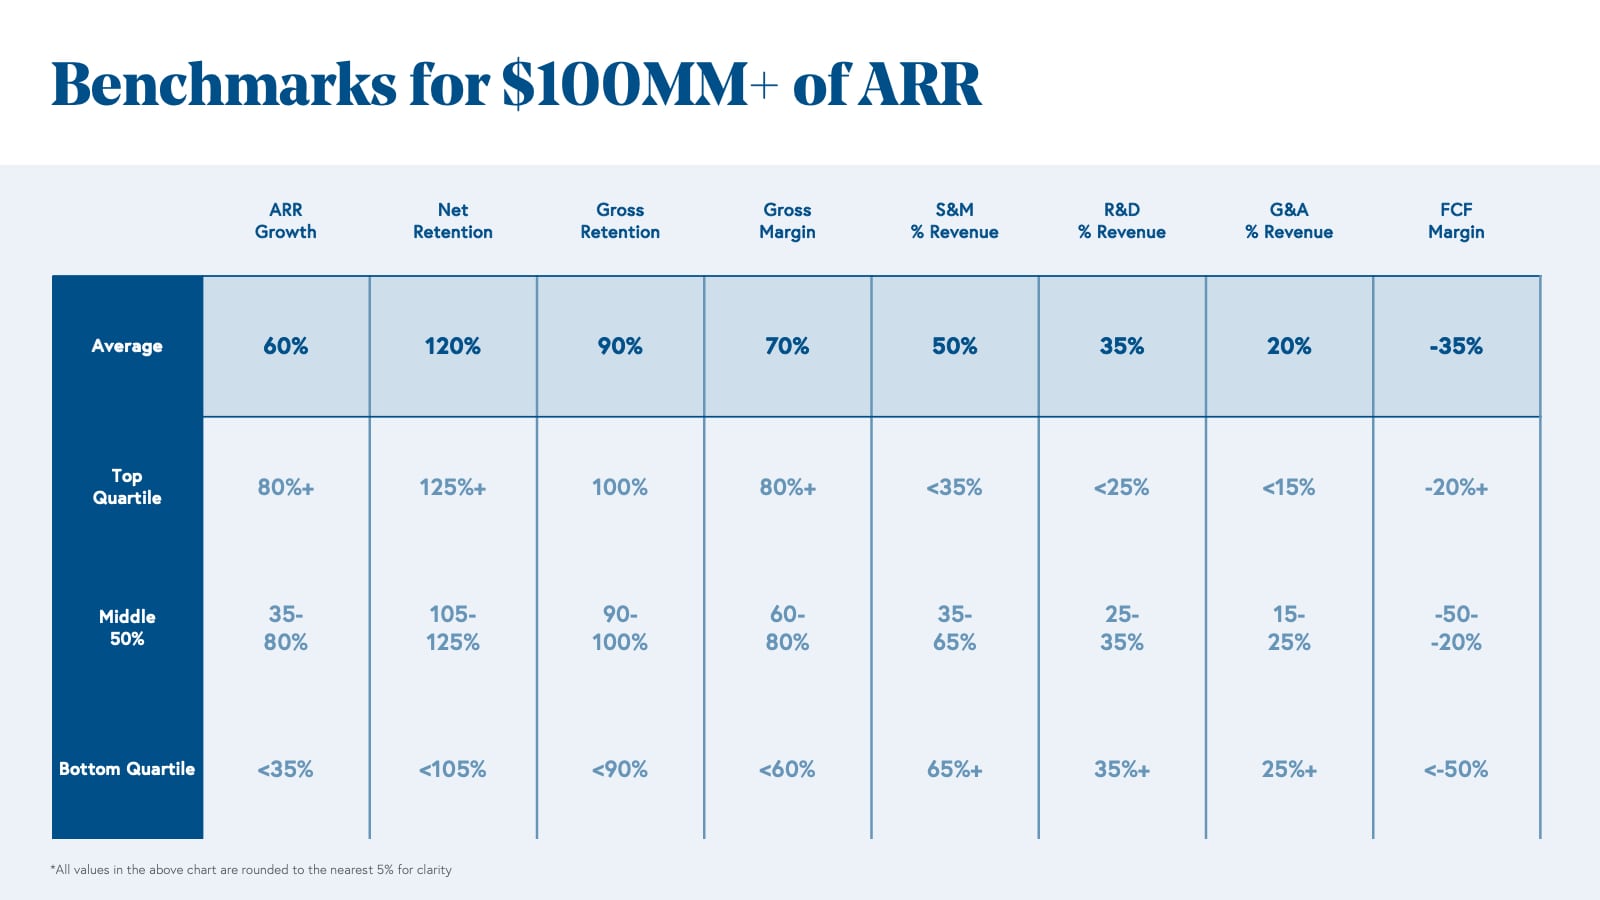
- At $100MM ARR: the averages of R&D are 35%, S&M 50%, and G&A 20% of revenue.
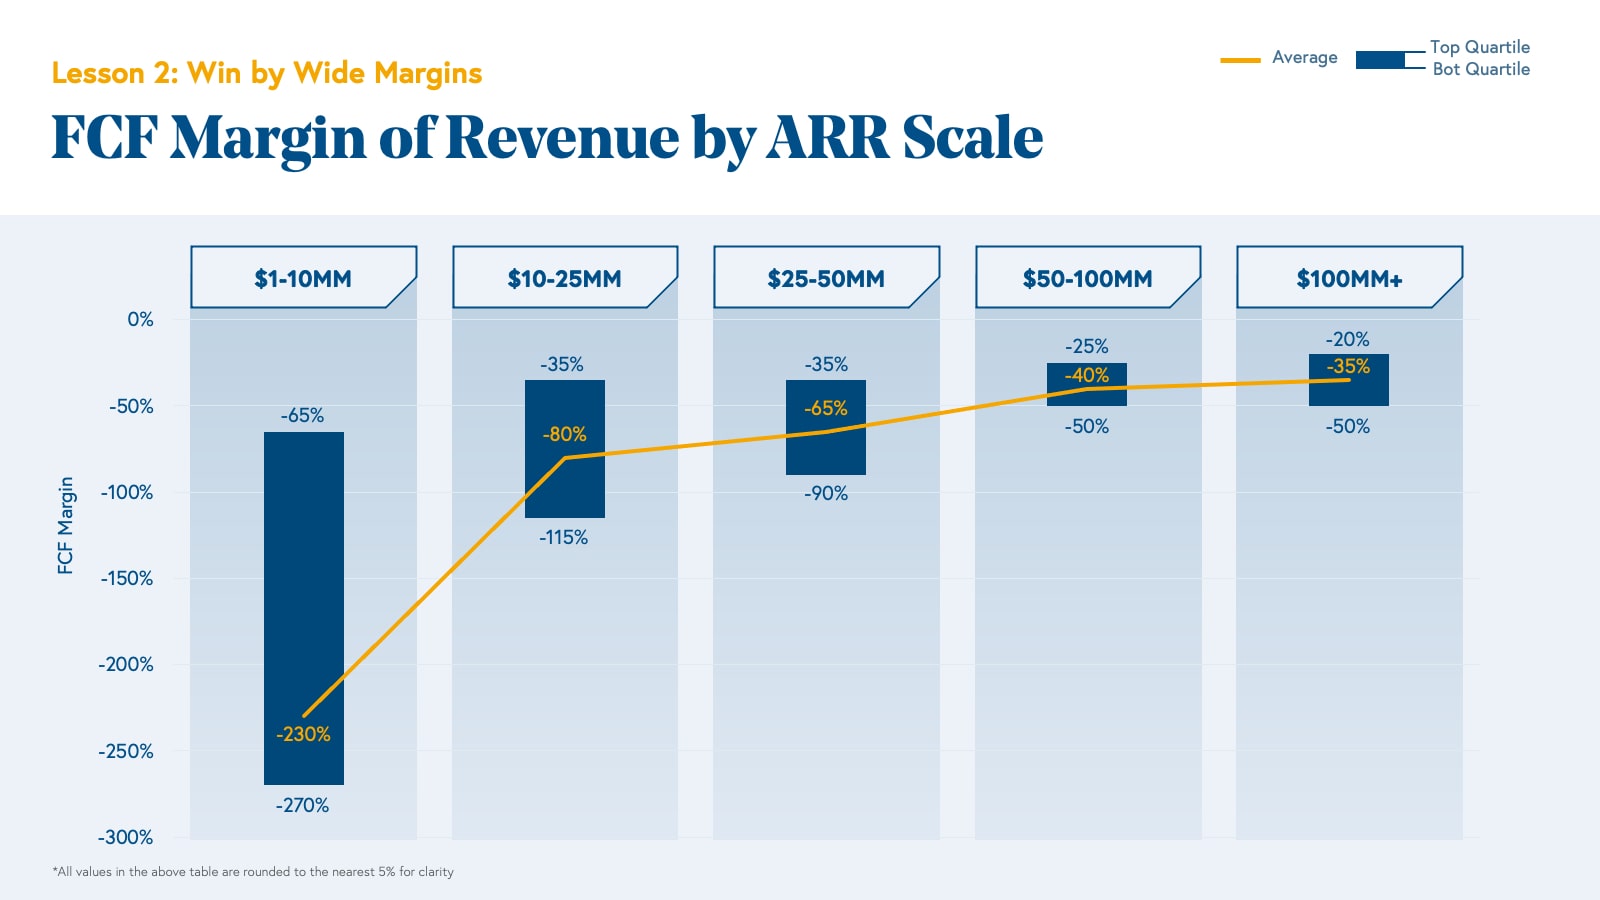
- Move toward free cash flow (FCF) breakeven: on average, cloud companies reach ~–35% FCF margins at $100MM+ ARR.
Lesson 3. Know your worth
- Over the past decade, funding rounds valued on average at ~30x ARR for $1–10MM, ~15x for $10MM+.
- Recent years show higher averages (20x–34x) for top companies.
- As ARR grows, rounds get larger and dilution shrinks.
Lesson 4. Plot your next milestone
- Use Bessemer’s benchmarks to guide progress.
- Download our templates for board or fundraising decks to show off your metrics.
Lesson 5. Run the public playbook
- Target $100MM+ GAAP revenue to FCF breakeven within 1–2 years before eyeing public markets.
Lesson 1: ARR is the North Star
Annual Recurring Revenue (ARR) is the primary metric for measuring scale in cloud companies.
Benchmark growth rates by scale:
- $1–10MM ARR: 200% average growth
- $10–25MM ARR: 115% average growth
- $25–50MM ARR: 95% average growth
- $50–100MM ARR: 60% average growth
- $100MM+ ARR: 60% average growth
Defining ARR and CARR
While GAAP (generally accepted accounting principles) revenue only accounts for the ratable amount of annual contract value that cloud companies earn in a given period (whether recurring or one-time revenue), ARR gives full credit for the annualized recurring contract and nets out non-recurring revenue. As a result, revenue generally lags ARR, but in the private cloud markets, most investors are comfortable giving companies forward credit because ARR will manifest in revenue eventually, assuming the high retention rates that are common in cloud. ARR gives cloud companies credit for their customer growth that GAAP revenue alone would not capture. CARR (Committed ARR) builds on the ARR concept by adding committed but not yet live contract values to total ARR and netting out forecasted churn or downsell. CARR can be an even better indicator of topline momentum than ARR for some cloud businesses, as it captures more customer information than does ARR, but CARR-to-ARR lag for companies with long implementation timelines can be a drawback.
Scale wins in cloud economics.
As you acquire more customers and generate more ARR or CARR, generally the valuations you receive will, in turn, increase. In the 10 Laws of Cloud, we explain how scale wins in cloud economics—the larger you are, and the more revenue you have, the more defensible your cloud business. Market leaders create a virtuous cycle with pricing power, talent, and product that reinforce their lead. Growing ARR should therefore be your company’s top priority. In this lesson, we explain the main ARR drivers that matter as your cloud company grows: ARR Growth, Growth Endurance, and Net and Gross Retention.
ARR growth rate
ARR growth rate is a key signal private investors use to determine whether a company has the product, sales efficiency, and market leadership to become a market leader. While metrics like CAC payback for sales efficiency or monthly active user (MAU) growth for product usage are more exacting measures, the growth rate is a good proxy for the overall performance of a cloud business—not just historically, but also in the future.
While it’s generally accepted that more ARR will result in a higher valuation, the less intuitive reality is that the growth rate of that ARR matters almost as much as the quantum of ARR itself. The higher your growth rate, the quicker your company will “grow into” its valuation; therefore, investors are willing to pay higher prices for a higher growth rate. Maintaining an average or best-in-class ARR growth rate is a key driver of success. So what does that look like over time?
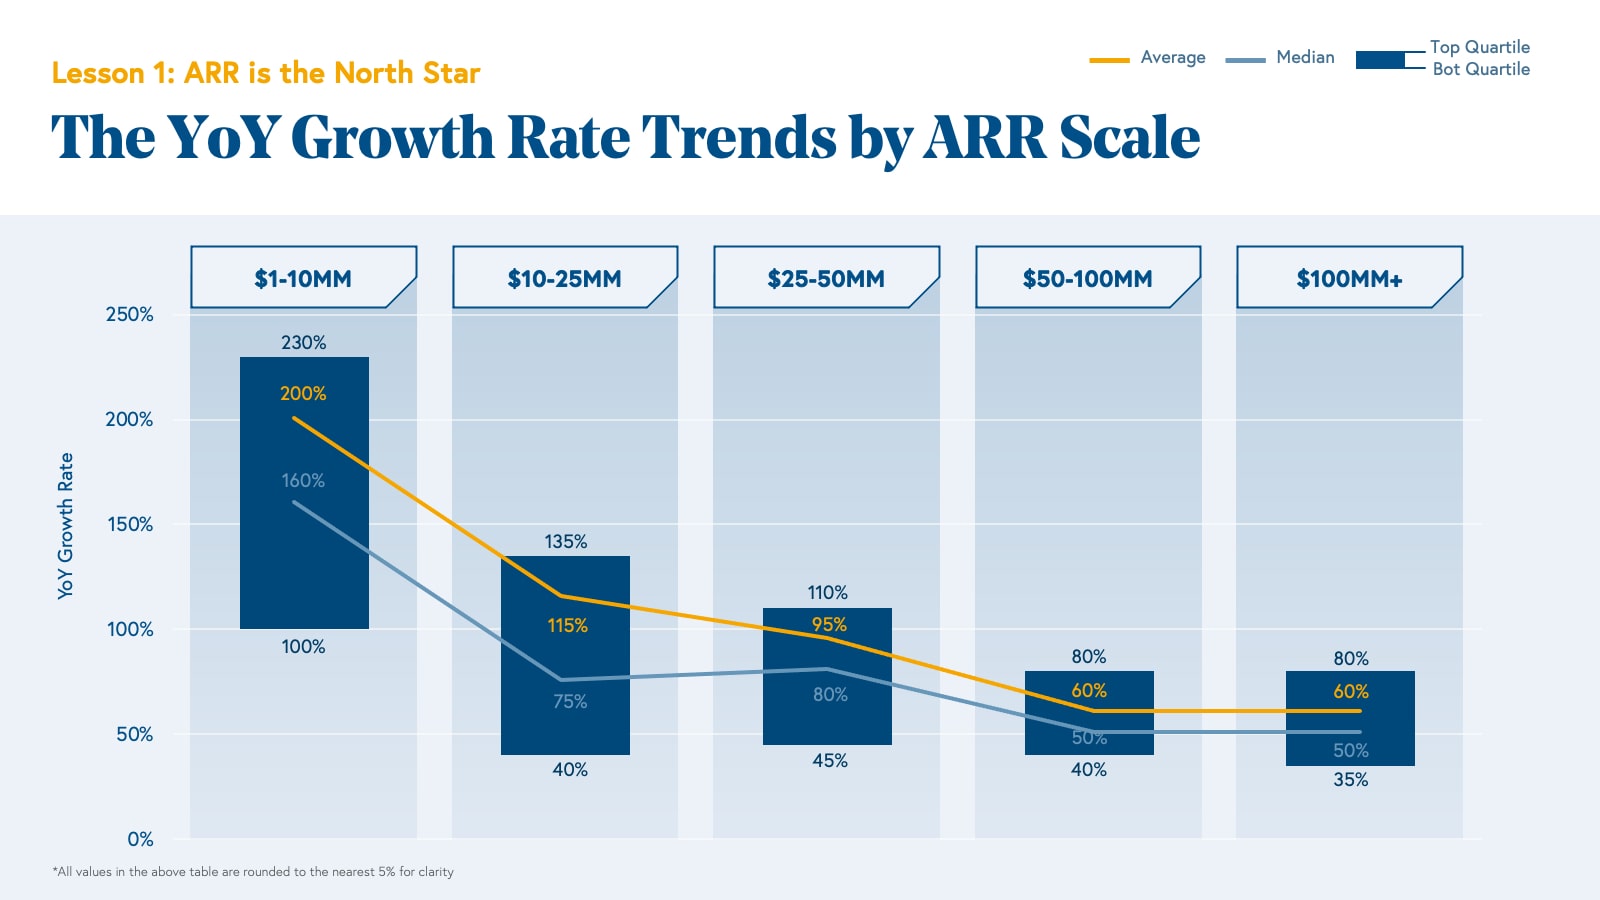
Examining Bessemer’s cloud portfolio over the last decade, we find that the expected growth rate for companies decreases over time, as it is easier to grow at a higher rate on a smaller base of revenue and the marginal dollar is always harder to acquire. The average growth rate for companies between $1-10MM of ARR was nearly 200%, and this average decreases to 60% for companies over $50MM of ARR. We also find that the middle 50% of cloud companies have a tighter and tighter band of growth rates as ARR scale increases: the middle 50% of companies from $1-10MM of ARR are growing from 100-230% while the middle 50% of companies from $50MM+ of ARR are growing from 35-80%.
While there is some selection bias for companies that are at the higher ends of the ARR range (the companies that make it to that scale are the most successful ones), an important note is that average growth rates continue at high rates, even at scale. We find that this tends to happen for two reasons.
First, by $50MM or $100MM of ARR, the Cloud Giants are crowned. Given the virtuous cycle of market leadership, the leaders that emerge are able to further consolidate their markets, accelerating growth. For example, when Bessemer first funded PagerDuty in its Series B in 2014, it was at $12MM of ARR and had material competition from VictorOps, OpsGenie, and xMatters. By the time PagerDuty crossed $100MM of ARR in 2018, all of these competitors had either been acquired or fallen behind, leaving PagerDuty as the only true standalone company in the incident response category and allowing it to capture more of the pie.
Second, market leaders tend to accelerate their growth and expand their total addressable markets (TAM) by adding “Second Act” products, so even if there is growth decay in the core product, there are constant second, third, and even fourth winds behind company growth as a whole. Cloud leaders tend to be multi-product companies. For example, our portfolio company Toast has successfully layered Payments and Capital onto its already-large point of sale (POS) business.
Examining our cloud company data, we also note that it is very rare to see a best-in-class growth rate company quickly devolve into a laggard. Similarly, it is very rare to see a mediocre grower evolve into a high-grower. Generally, companies’ modus operandi are set early, and reorientations of the magnitude needed to change growth trajectory are difficult. Taking the recent example of Toast, throughout its entire journey from $1-100MM+ of ARR, it stayed within the top quartile growth range (or very close to it). But, the jump is possible, and Procore provides a good example of a company with the product-market fit and go-to-market muscle that was required to make it. Procore went from being a bottom quartile grower between $1-10MM of ARR to a top quartile grower by $25-50MM of ARR, going public in May 2021 for over $10 billion.
Growth endurance
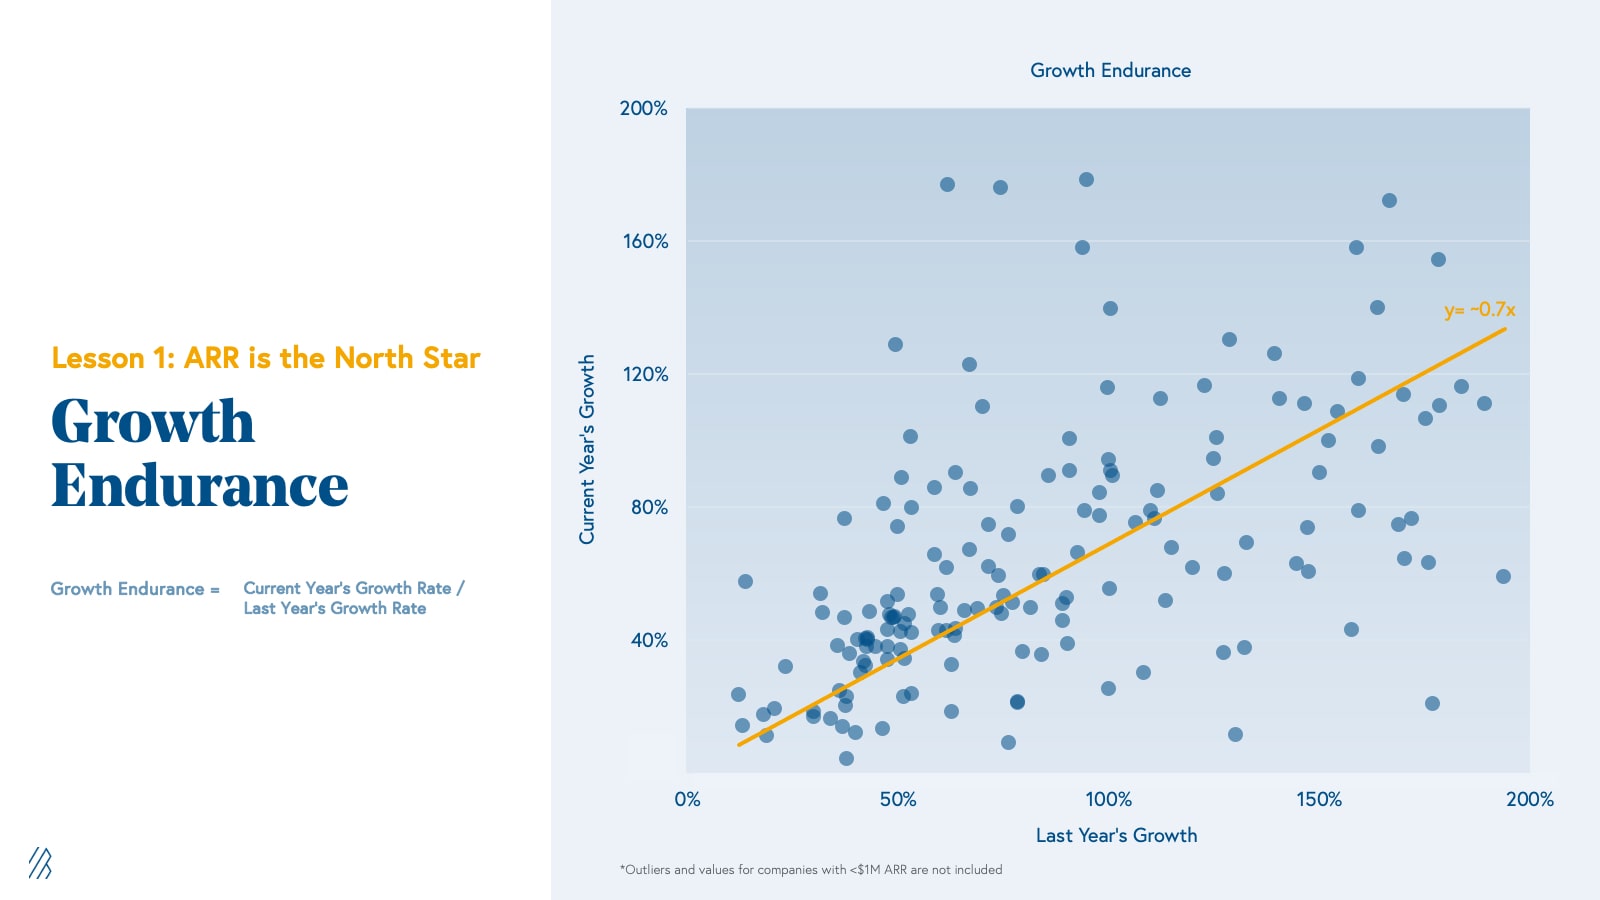
While we know the average growth rate for a cloud company tends to decrease over time, as investors we are often tasked with modeling out the future growth of a company based on imperfect information. A helpful heuristic that we like to use is the idea of Growth Endurance, which we explored in this year’s State of the Cloud 2021. Growth Endurance is the rate at which growth is retained from one year to the next, which tends to be very consistent in cloud companies. As the analysis below shows, when we plot the percentage of ARR Growth lost between each year, we find that it decays at a fairly predictable 30%. As a private cloud company, you should expect next year’s growth rate for your business to be ~70% of the current year.
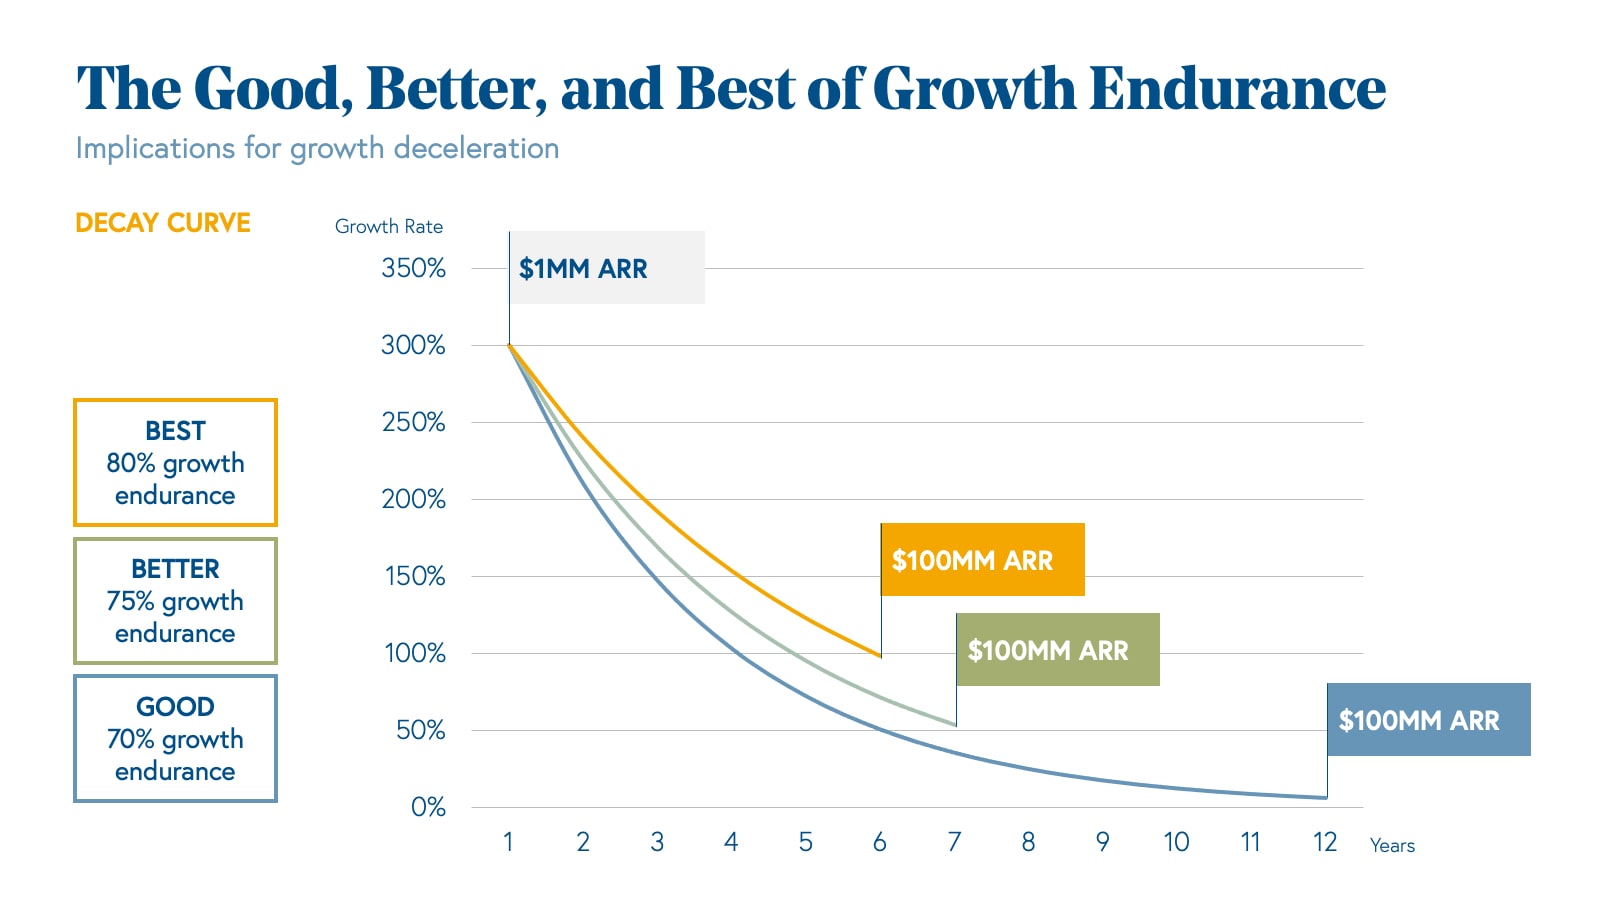
While Growth endurance in the private cloud market is strong at ~70% YoY, within the public cloud landscape as measured by the BVP Nasdaq Emerging Cloud Index, it is even stronger. Among that group, Growth Endurance is ~80%. Below we show the impact of growth endurance on when a company should reach $100MM of ARR, assuming that it triples to $1MM of ARR in year 1 (a typical trajectory at that scale).
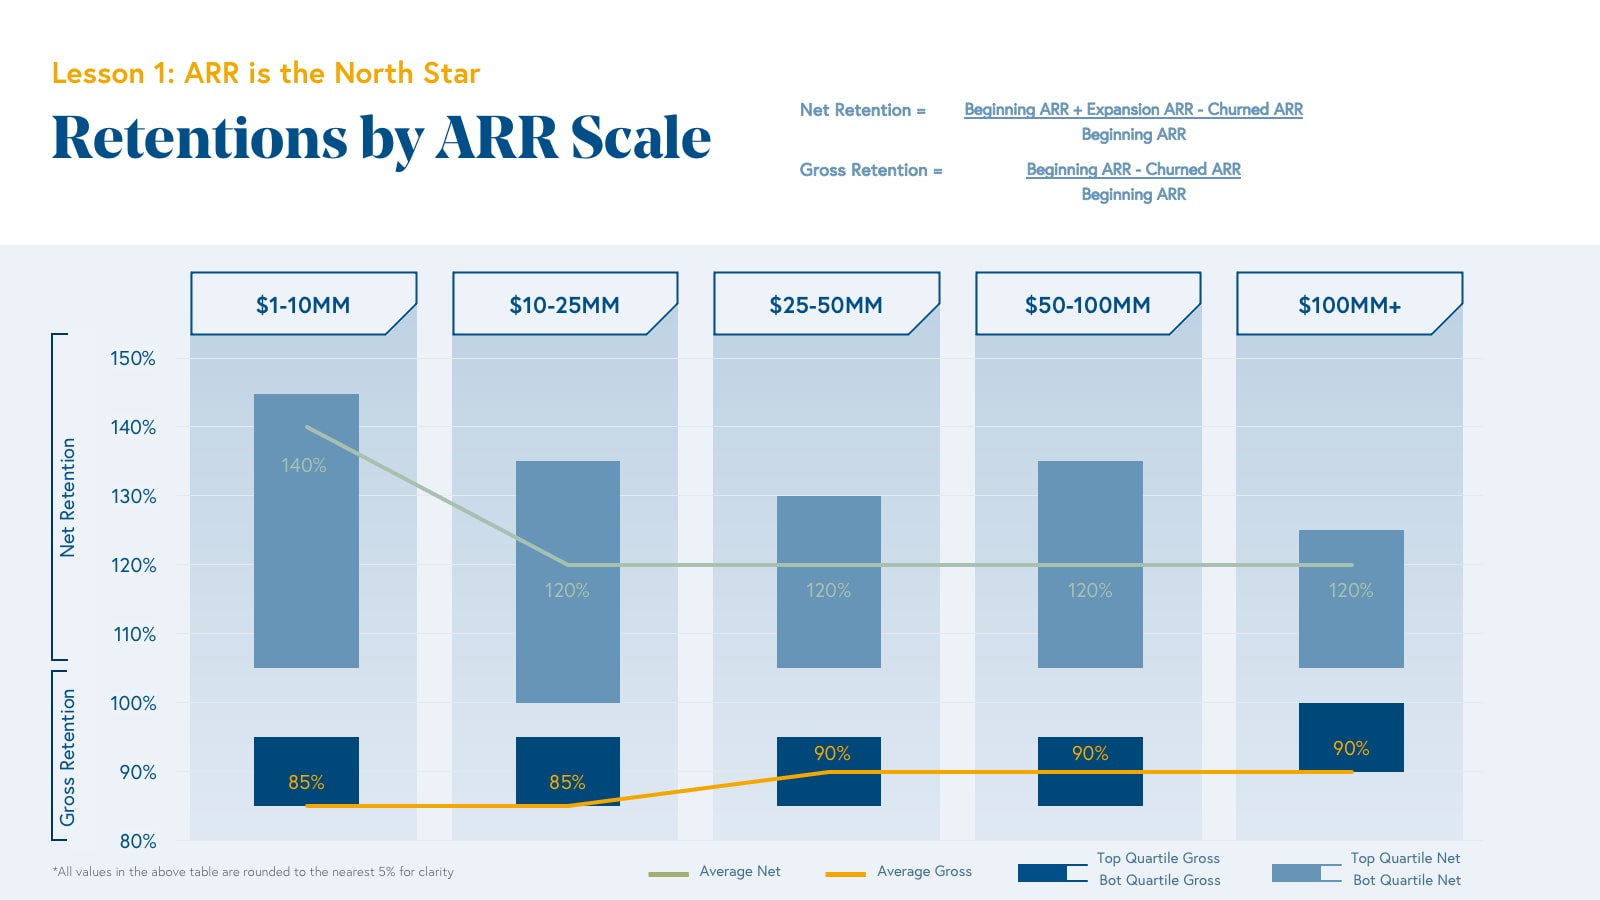
Gross and net retention
In the cloud business model, companies pay upfront customer acquisition costs, but are generally only able to monetize monthly thereafter, creating a negative cash flow dynamic. However, given the fantastic margin structures for cloud companies, these customers generally end up being incredibly profitable and generate large streams of high-margin recurring revenue in the long run—if, and only if, they can be retained.
Retention is one of the most important measures of your cloud business’ health, as it preserves the unit economics of historical customer acquisition. Furthermore, when you retain existing customers, you do not need to use valuable sales and marketing dollars to refill a leaky bucket but can use that capital to generate net new revenue (and therefore net growth). Every cloud company quickly learns that every percentage taken out of your retention is taken out of your growth rate.
Gross retention (dollar basis) tells you what percentage of revenue your cloud company has maintained over a given period. It nets out the revenue from customers who turned off or downgraded your service, but does not account for any expansion. Looking at gross retention by ARR range, we find that it is relatively consistent at 85-90%. While it would be easy to conclude that gross retention is a negligible metric, it is actually quite the opposite: It is difficult to build a successful cloud business without having high gross revenue retention. That said, gross retention will vary based on customer segment, and we have seen successful cloud businesses that address SMB segments -- such as HubSpot (in its 3 years pre-IPO) -- with 70-80% gross retention. In cases like these, you should make sure to keep a close eye on CLTV / CAC to ensure that the unit economics of incremental customer acquisition remain healthy.
Net retention, meanwhile, differs from gross retention by accounting for the upsells and expansion revenue that your cloud company earns over a given period. Unlike gross retention, the data for net retention shows more variance over time, ranging from 105-145% between $1-10MM of ARR and decreasing slightly to a range of 105-125% by $100MM+ of ARR.
For net retention, it’s worth noting that the middle 50% range, regardless of ARR scale, still exceeds 100%. Only the bottom quartile of cloud companies have <100% net retention rates. That is, the middle 50% of cloud companies experience a dynamic in which their existing customers pay them more over time, not less, to the extent that upsell/expansion revenue is greater than any downsell/churn. The average net retention is 140% between $1-10MM of ARR, decreasing to 120% for $10-100MM+. Again, net retention often differs by segment, with SMB segments experiencing lower net retention rates than enterprise segments. For example, when Mindbody went public it had 109% net retention on ~$2K ACVs—compare that to Okta which had 123% net retention on $50K+ ACVs.
Cutting the data by industry rather than ARR range, we find that gross retention largely hovers in a similar range but net retention varies much more across industries. Developer tools have the greatest average and median net retention rates across our portfolio, in line with what we would expect from a bottoms-up sales strategy that expands seat count and usage as it permeates an org. Collaboration software shows a similar dynamic. Though there are exceptions, industries such as sales and marketing software, customer experience software, and finance / legal tech tend to have lower net retention, likely because land ACVs are higher and expansion over time is lower (often these tools sell a complete platform, rather than individual seats or usage tiers).
Lesson 2: Win by wide margins
While ARR and growth rate are the North Stars when it comes to evaluating cloud businesses, these metrics are not enough to capture how well your company is performing. If we have two companies with the same growth rate and revenue, but one of them is spending $10MM on sales and marketing and the other is spending $50MM, it’s pretty obvious which has a more compelling product.
To understand how your cloud company is operating under the hood, you need to roll up your sleeves and dive into costs and expenses. The most relevant numbers are gross margins and free cash flow margins, with operating expenses—including sales and marketing, research and development, and general and administrative costs—all contributing directly to profitability. In this next lesson, we delve into each of these costs and expenses to help you target the appropriate margin structures for your scale.
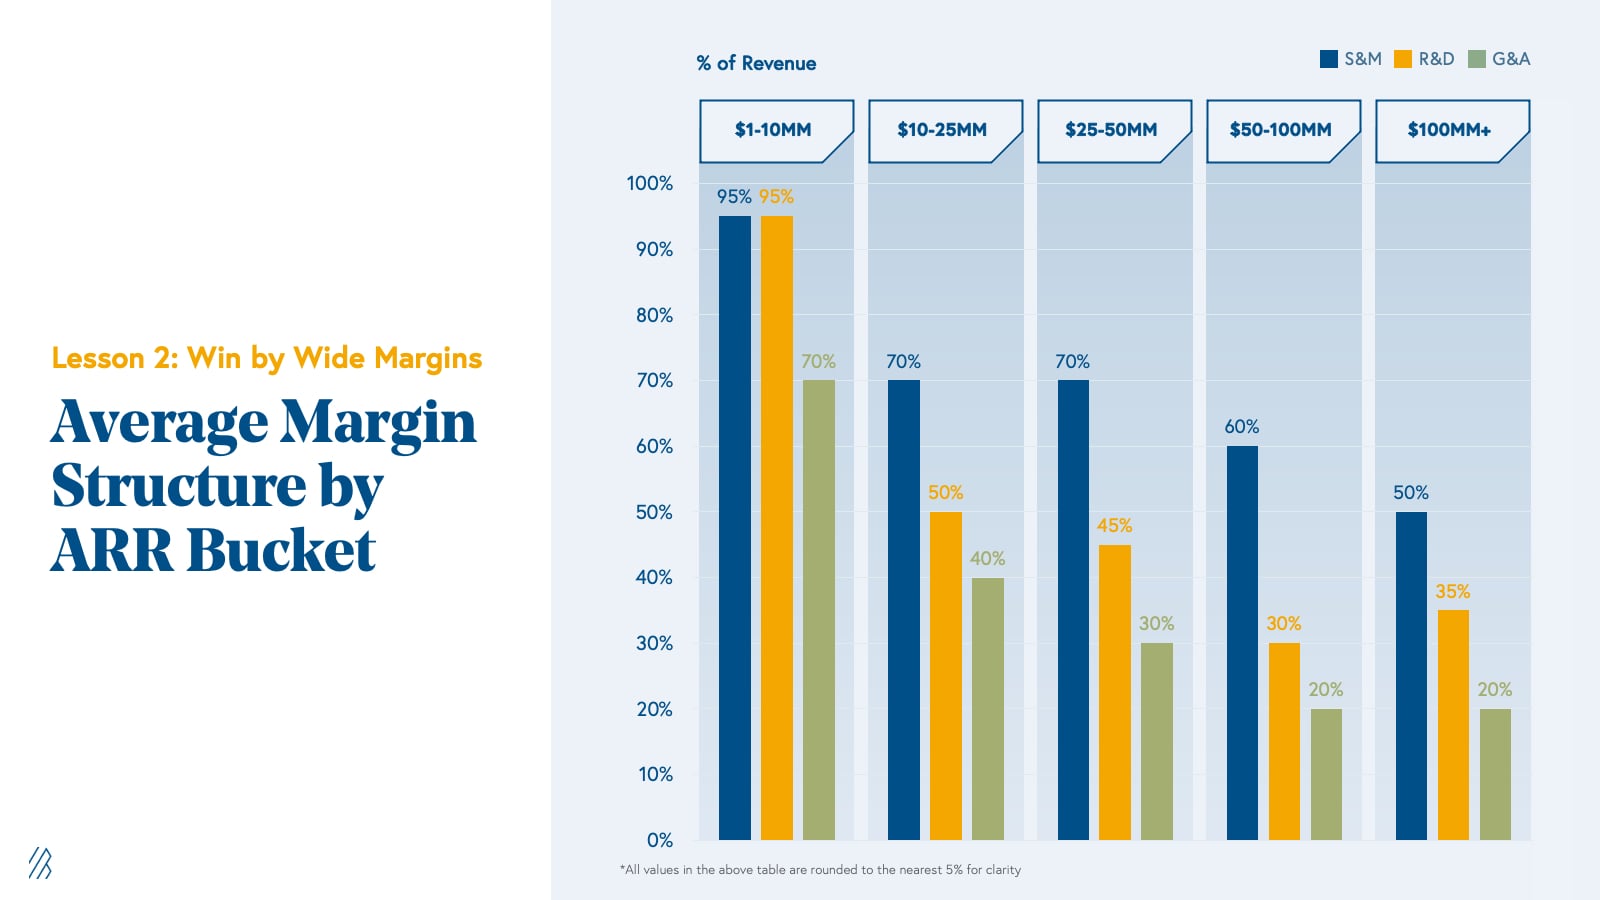
Gross margin
Gross margin averages:
- $1–10MM: 70%
- $10–25MM: 70%
- $25–50MM: 65%
- $50–100MM: 65%
- $100MM+: 70%
The beauty of software is that there is practically $0 marginal cost to replicate and distribute it. Gross margin, a company’s revenue after the cost of goods sold (or gross profit) divided by revenue, is an incredibly important metric for cloud companies because it measures the effectiveness with which companies can deliver their software to their customers. The aim is to make it as high as possible, reflecting the lowest marginal cost. A high gross margin means that a cloud company can invest more into operating expenses rather than product delivery, leading to more selling, product iteration, and ultimately, growth. Typical expenses that you will find in COGS for cloud companies are hosting costs, software implementation costs, and services costs, including customer success—these are all variable costs.
Given that the marginal cost for delivering software should be very low, investors expect gross margins for cloud companies to stay within a fairly tight band. It is perhaps the only operating or cost metric that has very little wiggle room—the average gross margin for a cloud business regardless of maturity is 65-70%, and the distribution of the middle 50% stays within ~60-80%.
That said, some of the strongest cloud companies in our portfolio have been ones with gross margins below that range. For example, throughout much of its life in the Bessemer portfolio since the seed round in 2009, Twilio’s gross margin was ~50%, which accounted for the fact that it had to pay telecom service providers in its COGS. Twilio continues to be one of the strongest BVP Nasdaq Emerging Cloud Index performers today with a market capitalization of over $60 billion.

Operating expenses
After you deliver your product and incur the cost of doing so, you can spend the remaining amount of money—your gross profit—on operating expenses and retain any residual as cash flow. These fall into three major buckets: research and development (R&D), general and administrative (G&A), and sales and marketing (S&M).
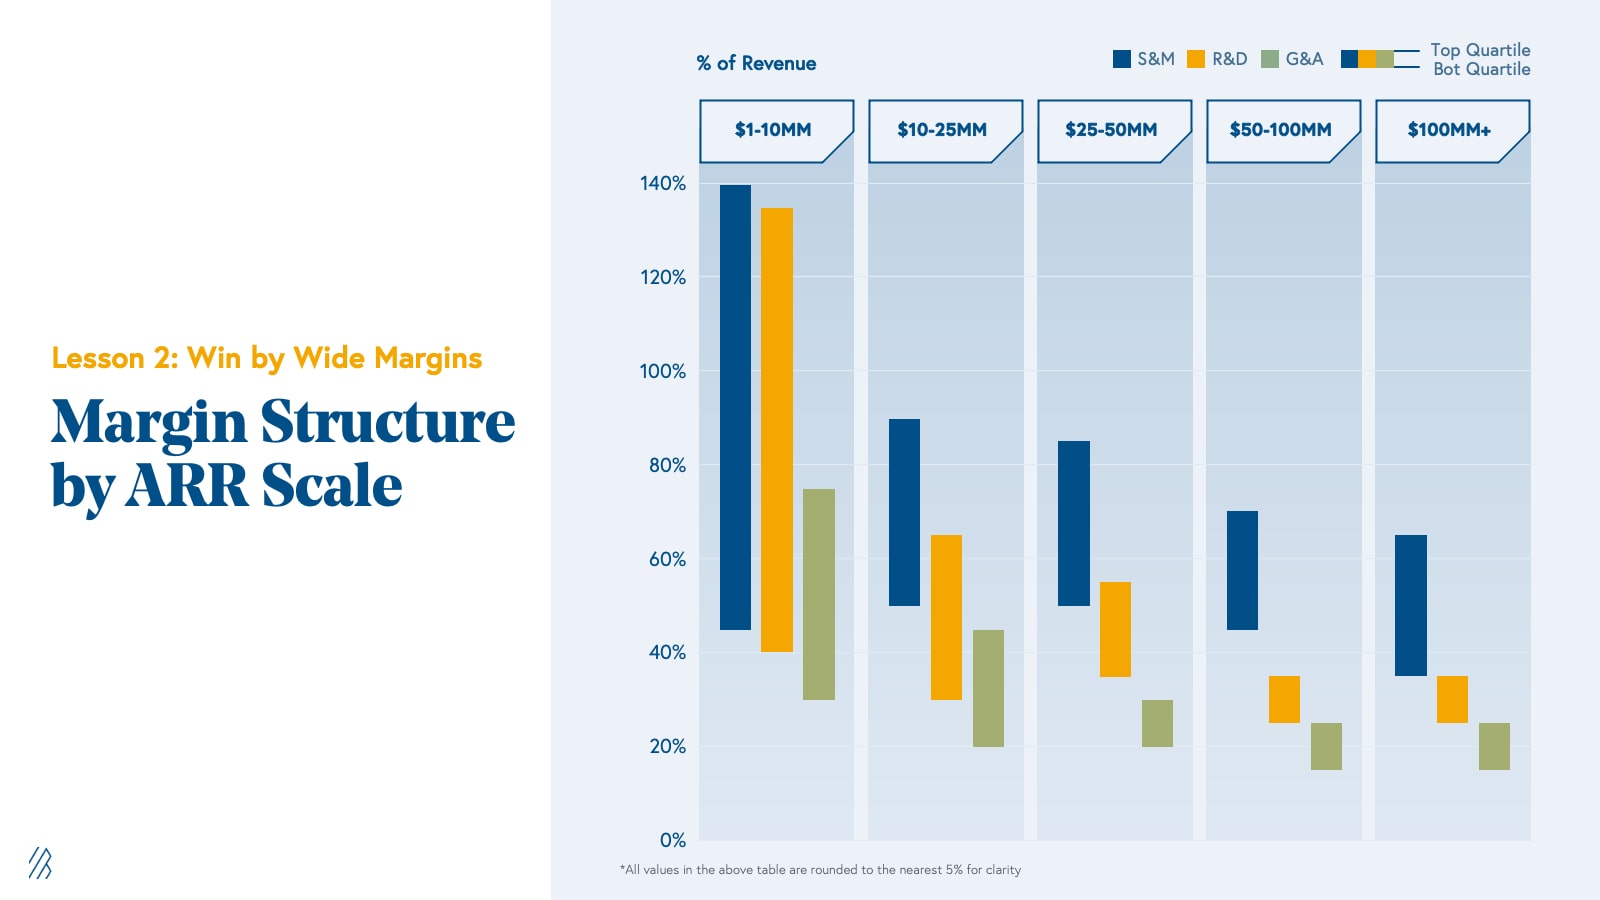
R&D expense is the income statement line item that captures product, including product management, product development, engineering, and design. It is the core of what your cloud company is, and in turn, core to what you will be able to sell. Given its importance to your business, the irony is that R&D tends not to be the major cost driver for most cloud companies, representing an average of 95% of revenue in the early years but decreasing to only 35% by $100MM+ of ARR. This is generally because an investment in the product—and product innovation—propels a company’s growth in the early years, but ongoing investment in R&D does not scale linearly with revenue growth over time. There will be product enhancements and “second act” products that require investment, but maintenance and improving the core never costs as much proportionally as creation. For example, when we invested in PagerDuty in 2014, R&D expense was almost 60% of revenue; however, by the time it went public, it was only about 35%.
The general and administrative (G&A) expense line item on the income statement generally includes the functions that run the back office of your company, including executive leadership, finance, legal and compliance, HR, information technology, and other administrative functions. G&A also includes outside costs for things like legal, travel, and auditing. Early on, G&A tends to be high as a percentage of revenue, since you need to establish these functions and hire leaders such as a CFO or CHRO; however, G&A costs reduce dramatically over time as these functions generally reach a growth plateau. No matter the size of the company, it will only have one CFO! Average G&A expense goes from being 70% of revenue from $1-10MM of ARR to only 20% at $50MM+.
Lastly, we turn to sales and marketing expense (S&M), which is the most important operating expense for cloud investors and founders to pay attention to. Sales and marketing expense is the income statement line item that captures sales expenses, sales compensation, content and brand marketing, demand generation, and customer success expenses related to sales, among other costs. This represents the highest cost centers in cloud companies, representing over 50% of the total revenues brought in every year, even at maturity, as salespeople and marketing talent scale more linearly with revenue growth.
As an example, when we invested in Adaptive Insights in 2013, the company spent almost 90% of <$20MM revenue on S&M, which had only reduced to about 70% on $100MM+ of revenue when it sold to Workday in 2018. As a consequence, you need to ensure that as your sales and marketing organizations are being funded, the ARR that they are generating justifies the cost.
CAC payback
Given the large share of revenue that sales and marketing expenses represent in cloud, sales efficiency is capital efficiency. It is impossible to have a rational amount of burn in a cloud company without sales and marketing efficiency. The primary metric that we like to use to evaluate S&M efficiency is Customer Acquisition Cost (CAC) Payback. CAC payback is the rate at which the costs spent to acquire a customer are repaid by that customer, and it usually includes sales, marketing, and customer success expenses (at least the portion that ties to renewal/upsell/cross-sell). That timeline matters because it is only after you repay CAC that you are generating profit on that customer. During the payback period you are simply recovering the money that you expended to acquire the customer. We also measure CAC payback against gross margin-adjusted ARR given that the variable costs associated with selling a cloud software product do not accrete to profit.
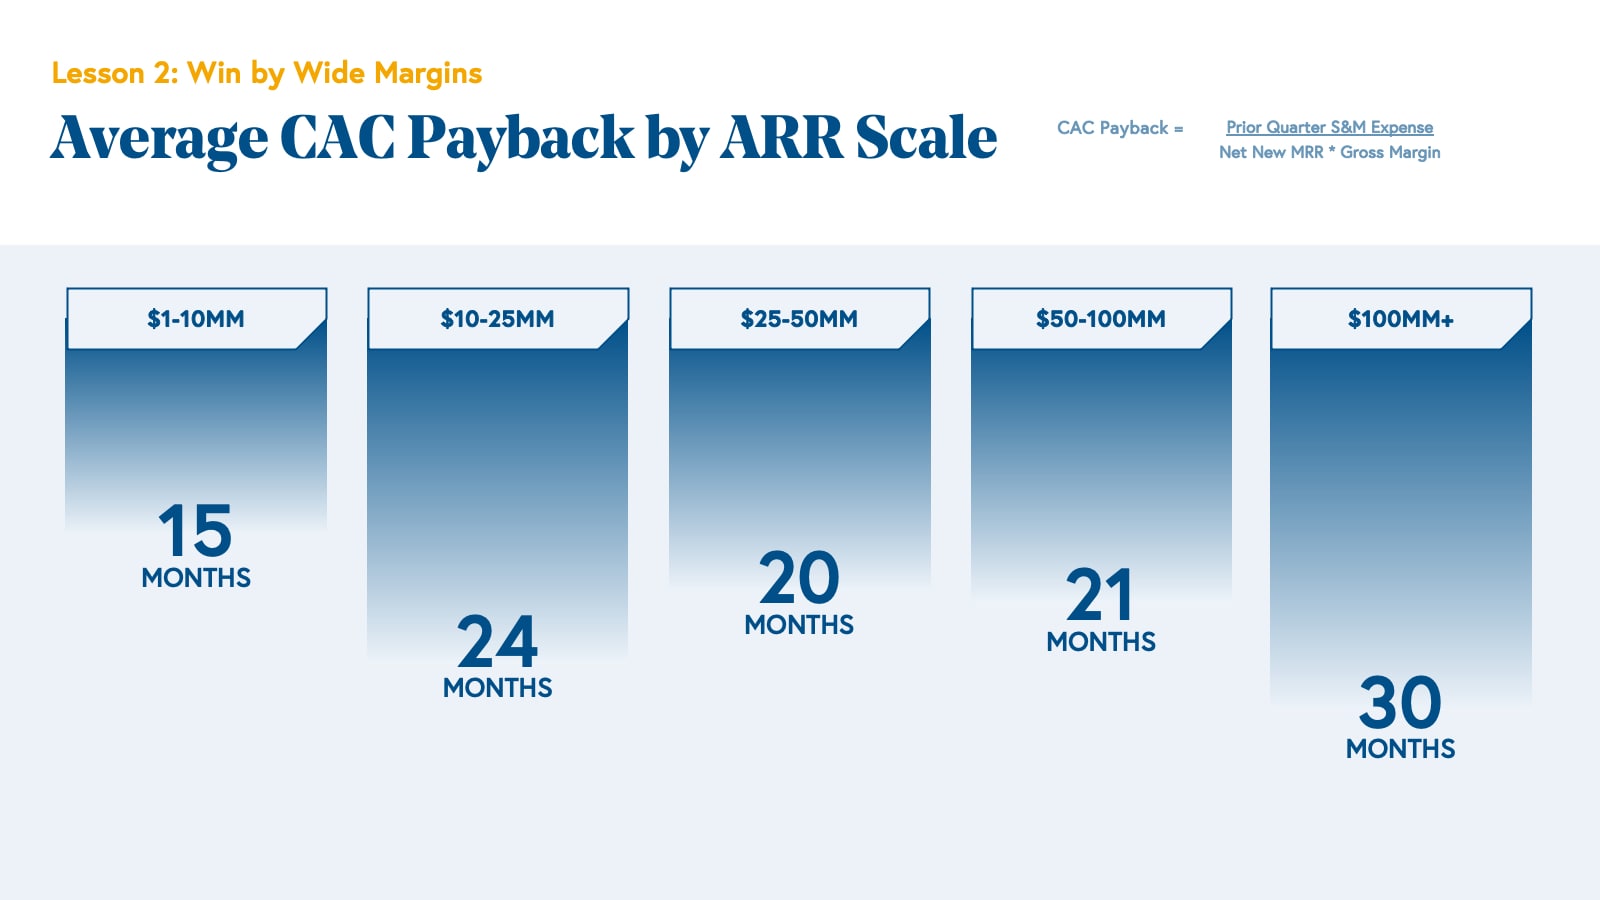
What we find is that the average CAC payback in the $1-10MM ARR bucket is 15 months, and this slowly increases over time, generally because early adopters are cheapest to acquire, and typically as a company matures it starts needing to compete for business with additional spend. However, by the $100MM+ scale, cloud businesses have generally unlocked a go-to-market model that rationalizes its S&M expense with strong Customer Lifetime Values (CLTVs). CLTV is the gross margin-affected value of a customer to a business over the course of its relationship, and it matters because the longer the lifetime, and the higher the lifetime value, the more profitable a customer is. It provides a guideline for how high customer acquisition costs can be, as only after 1x CLTV / CAC are customers profitable to a business; if CAC exceeds CLTV, you should not acquire incremental customers. We recommend investing in customer acquisition when CLTV / CACs are 3x+, and if much under that, continuing to experiment until you have unlocked stronger unit economics.
While we present the averages across Bessemer’s cloud portfolio, CAC paybacks can range materially, generally due to customer segment. For cloud companies selling into SMB-focused accounts, you should target CAC payback <12 months; for mid-market-focused accounts, target CAC payback <18 months; and for enterprise-focused accounts, target <24 months. The three-segment buckets tend to have different annual contract values (SMB the smallest, enterprise the highest) and churn rates (enterprise the lowest, SMB the highest), allowing enterprise-focused companies to support longer payback periods than SMB-focused ones. Put another way, enterprise segments tend to have long lifetimes and therefore high CLTVs and SMB short lifetimes and therefore lower CLTVs, thereby supporting significantly different customer acquisition cost structures.
Irrespective of the customer segment though, shorter CAC payback periods are always better than longer ones, since it’s only after the CAC payback period expires that customers become profitable to your cloud business.
Free cash flow margin
Free cash flow (FCF) represents the cash that your company generates, or loses, after netting out its COGS, operating, and capital expenses, and adding back non-cash expenses. The reason FCF is so important is that in cases in which businesses are consuming capital—they are burning cash—free cash flow limits the amount of runway that a company has without accessing the capital markets. For cases in which businesses are generating cash, free cash flow is capital that can be either reinvested in the business to catalyze additional growth or doled out to shareholders as returns. Free cash flow determines profitability. As such, FCF margin, which is the measure of cash flow divided by revenue, is a core cloud KPI. As investors, we want to ensure that as a business consumes money for product, go-to-market, and administrative needs, it is doing so prudently.
While it is favorable for businesses to generate cash, in the cloud economy, sometimes generating that cash sacrifices revenue growth that might otherwise be acquired with more aggressive spending. As investors, we compare a cloud business’ ARR growth to its burn in order to determine its capital efficiency, and sometimes we actually trade off profitability for growth.
For example, at IPO, the top quartile of BVP Nasdaq Emerging Cloud Index companies operated at cash flow breakeven. Snowflake, however, burned over $100MM but in the process grew revenue by almost $170MM and over 170% YoY, which is certainly also in the top quartile.
Efficiency score
When looking at burn for a cloud business, we want to consider it in the context of growth. Burning $100MM a year sounds high, but what if a company burned $100MM and added $1 billion of net new ARR? In that context, it doesn’t sound so bad. As this hypothetical suggests, investors look at the cash consumption of a business relative to the revenue that it generates, which is why the efficiency score becomes a helpful metric. Efficiency score equals FCF margin of ARR plus ARR year-over-year growth rate—as such it helps to show the tradeoffs between growth and profitability, but it is generally only applicable after achieving $25MM+ of ARR (before which revenue bases are too small for it to be meaningful). We encourage Bessemer portfolio companies to target 70% efficiency scores between $25-50MM of ARR, and a slightly lower 50% at $100MM+ as YoY growth rate drops off dramatically and companies find the right balance of profitability against a “grow-at-all-costs” model.
Efficiency score = FCF margin of ARR + ARR YoY Growth Rate
Younger companies tend to have higher growth rates and higher burn rates, and companies at maturity have lower growth rates and lower burn (and sometimes cash flow positivity). The “Rule of 40” is often referenced—that companies should have efficiency scores of 40%+ – but the average BVP Nasdaq Emerging Cloud Index efficiency score is actually closer to 50%, anchored up by the likes of Zoom, Shopify, Datadog, Crowdstrike, and other high performers. For example, even at over $3.8 billion of LTM revenue, Shopify is still growing ~60% YoY with ~10% FCF margins for an efficiency score of close to 70%.
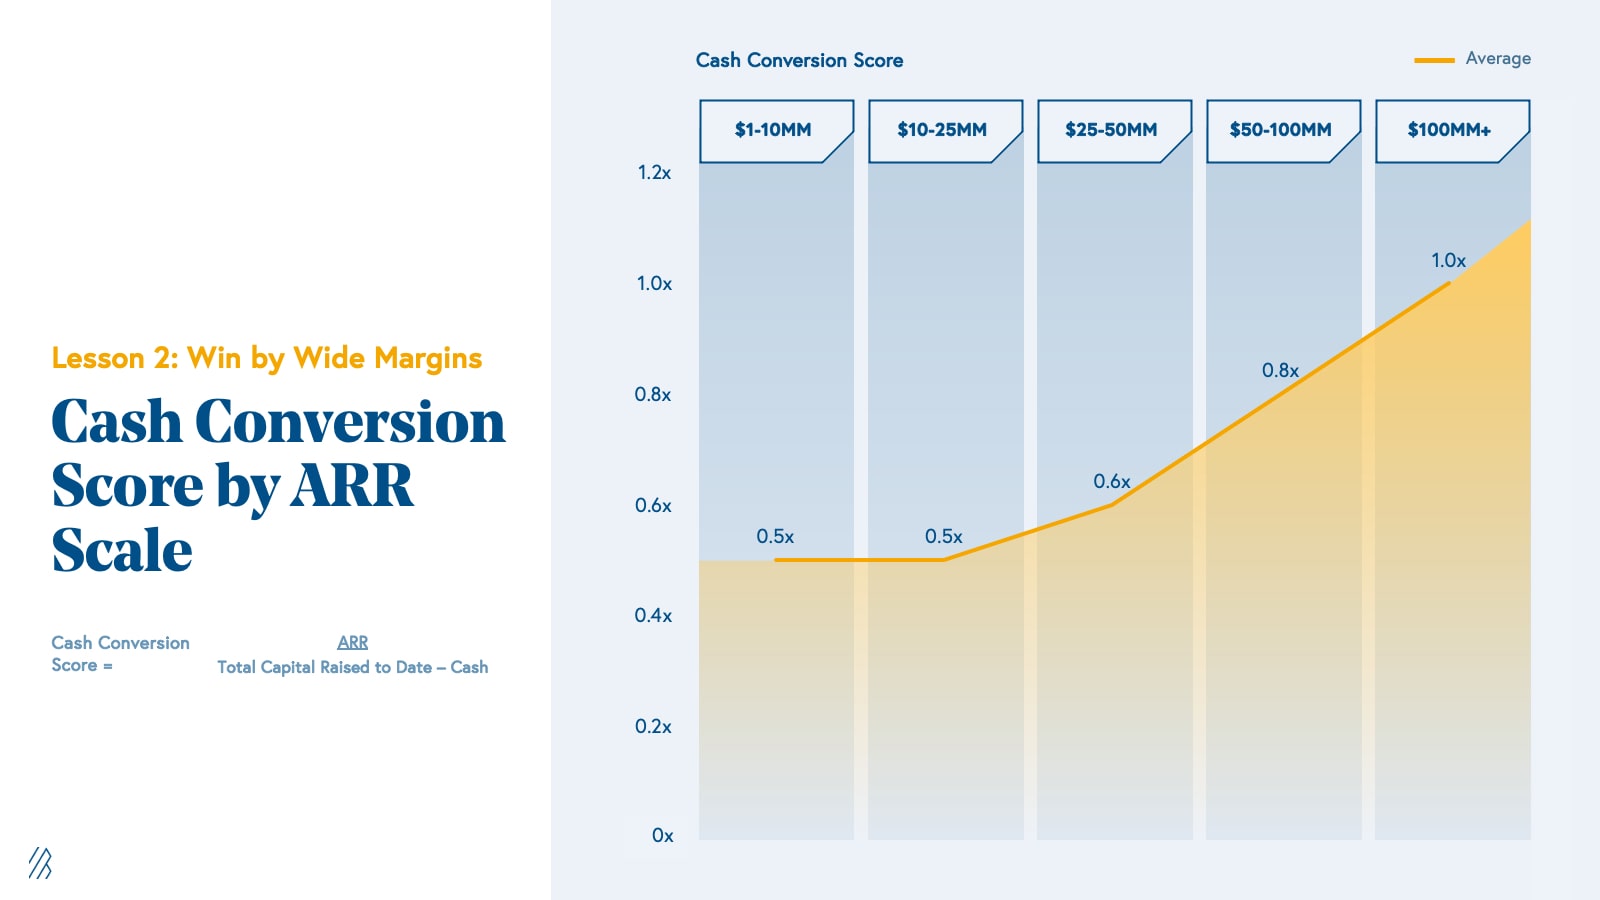
Cash Conversion Score
The Cash Conversion Score (CCS) is another metric that we often use to evaluate whether or not the capital that cloud companies raise and consume is generating a meaningful return. As the ratio of the ARR to total capital invested into a company minus cash, the Cash Conversion Score is effectively the return-on-investment of each dollar ever invested into a company. For both founders and investors, the Cash Conversion Score is, therefore, a powerful proxy for returns. If a company has a CCS of 1.0x, one dollar of investment into the business yields one dollar of topline recurring revenue. If we assume that the average cloud company gets a 10x revenue multiple (more in-line with historical norms vs. the 23x revenue multiple of ^EMCLOUD today), the one dollar of revenue multiplied by the 10x multiple equals $10 of enterprise value. Every dollar put into the company is getting a 10x return. Similarly, a company with a 0.1x CCS would only return the capital invested. ROI is not driven by Cash Conversion Score directly, but CCS indicates multi-year trends in a couple of incredibly important things, including product-market fit and a scalable sales and marketing organization. It is therefore a core KPI we track in evaluating cloud businesses.
The average Cash Conversion Score for cloud companies tends to increase as it matures, from an average of almost 0.5x from $1-10MM of ARR to almost 1x at $100MM+. For cloud companies, revenue generation tends to lag spending and only the strongest companies will scale to the $100MM+ mark where they are seeing the most leverage from their operating model.
One of the strongest companies on this metric—from the start—has been our portfolio company Zapier, which has raised only $1.3MM in its lifetime and announced in March 2021 that it exceeded $140MM of ARR. While we don’t hold every company to this CCS efficiency, we look for companies with best-in-class CCS of 1x+.
Lesson 3: Know your worth
As investors and board members of emerging cloud companies, one of the most frequent questions founders ask us is, ”What are we worth?”
Knowing the worth of a company matters to different constituents for different reasons: For founders, a higher round valuation might mean less dilution and ability to raise more capital and fund a new product or geography; for prospective employees, a lower valuation might mean more opportunity for upside and runway for career growth; and for current employees, a higher valuation might mean more value to their stock options. But just as company metrics are obfuscated in the private markets, so too are private company valuations. In this lesson, we will dig into what private investors are willing to pay for cloud companies, looking at valuation multiples, round size, and dilution.
Valuation multiples
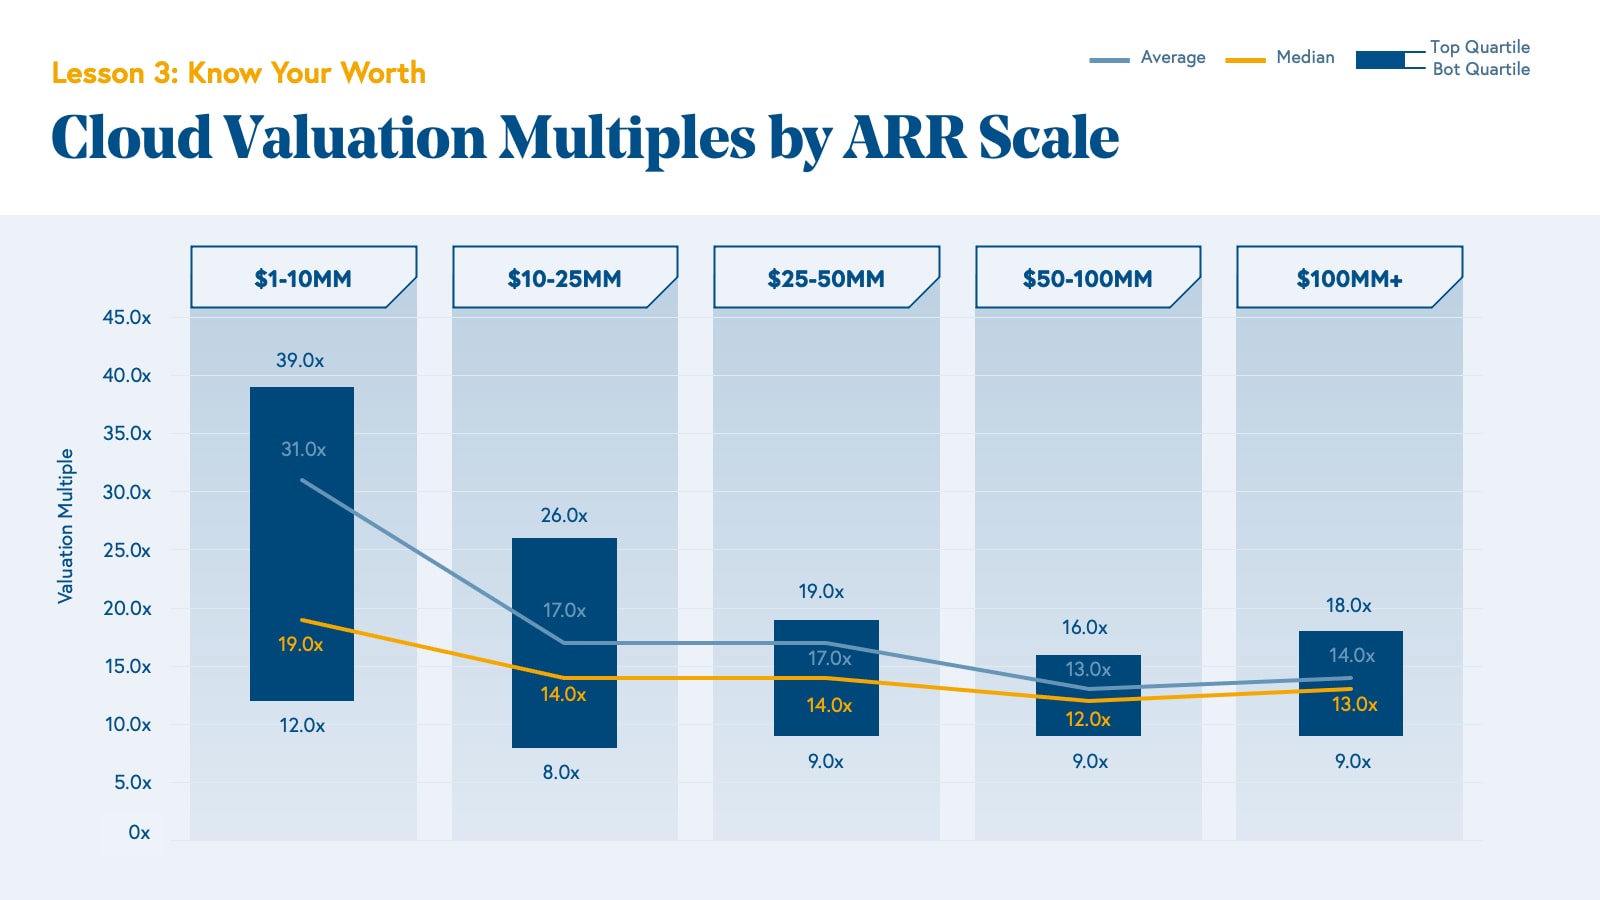
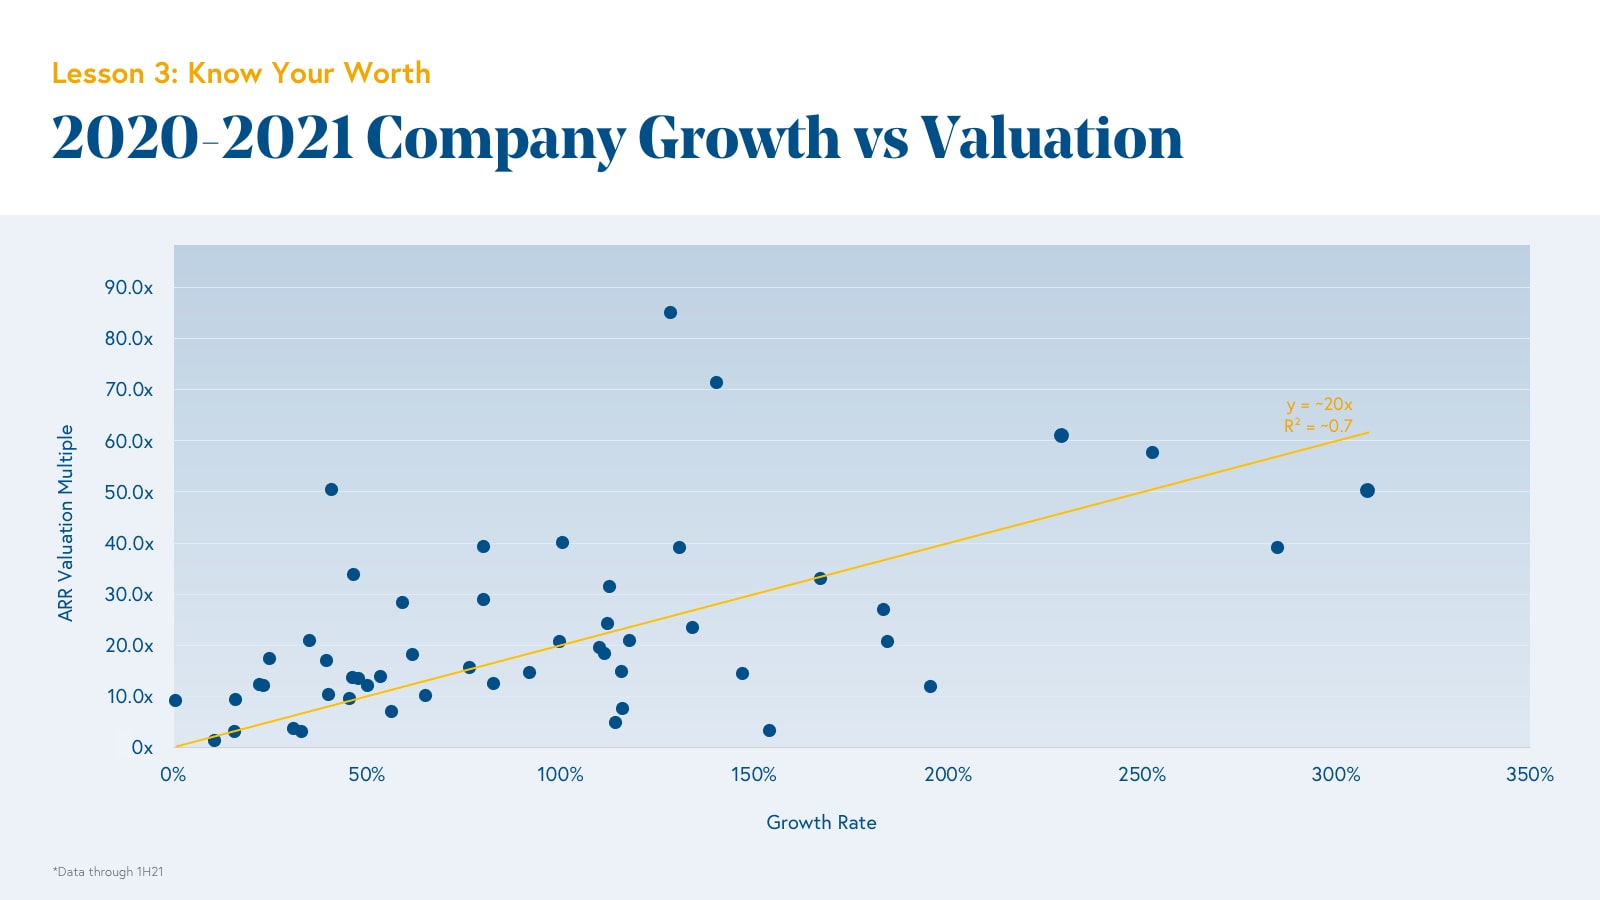
For cloud founders and executives looking to fundraise from VCs, understanding what multiple they will get is one of the biggest unknowns. In cloud, it is almost always a function of one thing: growth. In the private markets, investors are generally willing to pay ahead of ARR acquisition, betting on the company’s ability to “grow into” its valuation—but the higher the growth, the faster it “grows into” that number. For example, If a company is growing at 300% YoY, a 40x valuation multiple will become a 10x valuation multiple in just one year. As a consequence, the general rule is that higher growth rates command higher multiples. As growth rates steadily go down across ARR buckets, we therefore generally see that later stage companies raise at lower valuation multiples—and when they are still able to grow 100% at scale, they command premium valuations.
Across the past decade, Bessemer portfolio cloud companies have been priced at an average of over 30x ARR between $1-10MM of ARR, reducing to about 15x ARR beyond $10MM+. You might note that the valuation environment of the past decade was more conservative than that of 2021, as we analyzed in the Cloud 100 2021 Benchmarks Report. The average Cloud 100 multiple in 2021 was 34x (up from 9x in 2016). Below, however, we take a decade-long view in which the middle 50% of cloud companies priced at ~10-20x ARR, and, unlike in the Cloud 100 list, this data set is not limited to the 100 best cloud companies in the world in any given year.
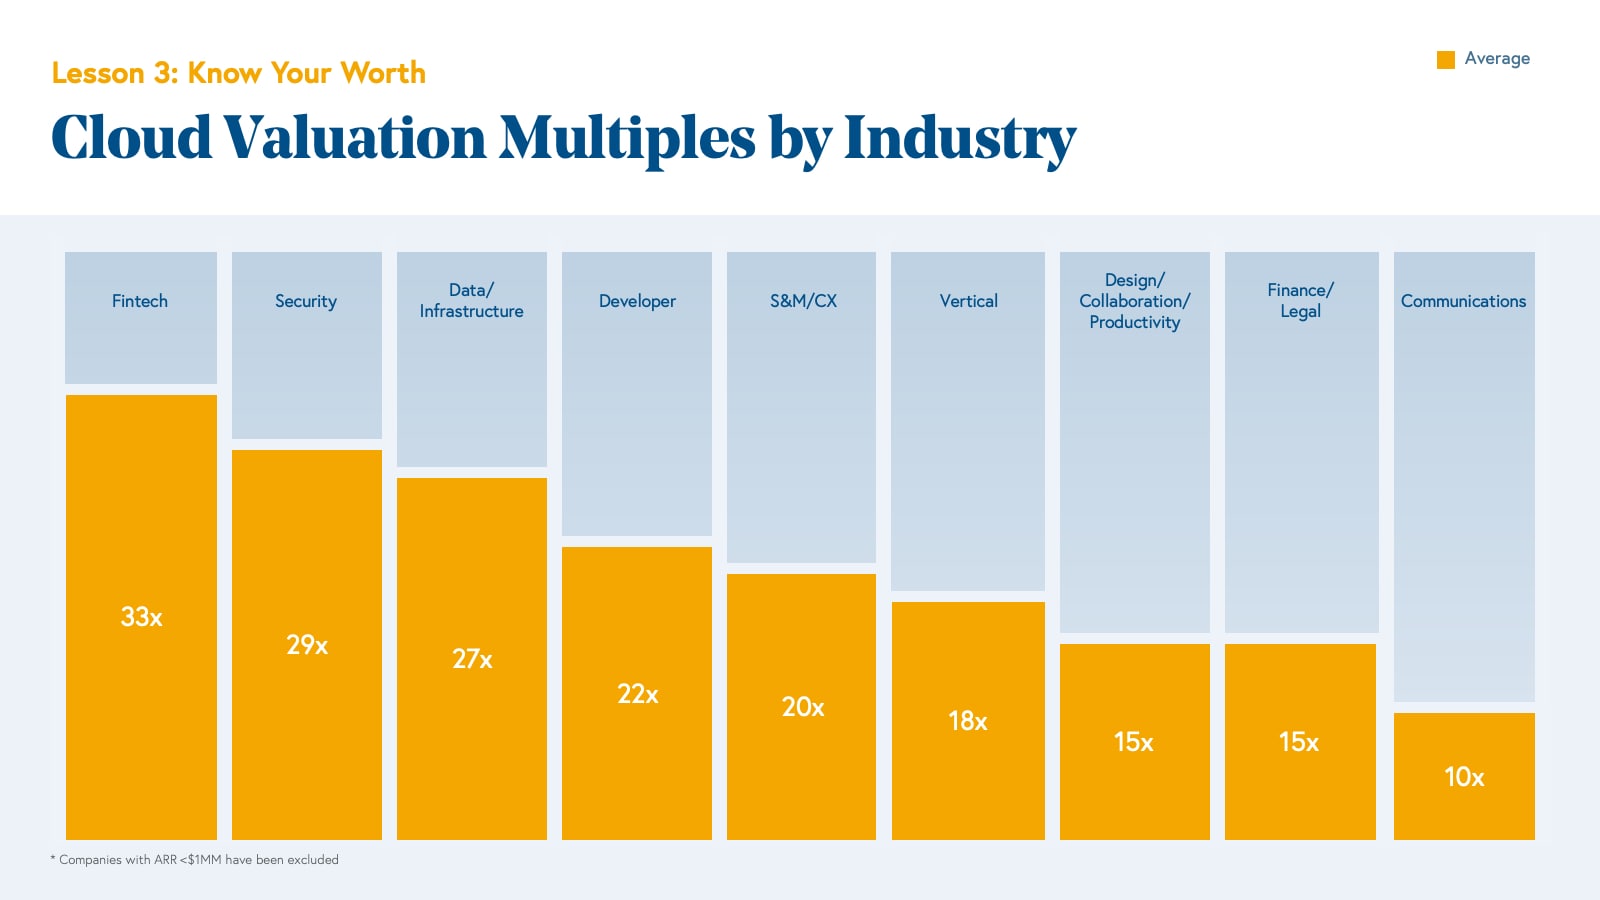
The valuations that different industries command can vary widely as well, oftentimes due to the size of TAM itself, but also because the specifics of selling into those markets correlate with different underlying growth rates. The industry that has commanded the highest multiples in the Bessemer portfolio over the past decade is fintech, with a 33x average, followed by security at 29x and data infrastructure at 27x; however, we have seen multiples as high as 50x and 100x in all three of these categories.
Today, though, we see a step-function change in the valuation environment for cloud companies, which we largely attribute to an increased quantum of capital in cloud, strong investor demand, and ongoing tailwinds that are driving growth rates to new heights. Below, we look at only the Bessemer portfolio companies in cloud that transacted between 2020-2021 and plot their growth rate relative to ARR. Regressing the two, you find that multiple is ~20x growth rate.
Round size
Round size is the other major lever that cloud companies can toggle when structuring a fundraise. Knowing how much to raise at each stage of growth while balancing the tradeoff of dilution and runway is a tension that you will likely have to grapple with.
As companies prove their abilities to grow, raising money gets easier and easier.
For most companies, the ability to raise money is a key to success. Without financing, you could not hire the engineers, salespeople, and other talent you need to grow. Given the negative cash flow dynamic that we covered in Lesson 2, cloud companies are often reliant on the capital markets to maintain enough runway for operations. The irony, though, is that as companies prove their abilities to grow, raising money gets easier and easier. Access to capital is easiest for those that do not need it. Over the course of a company’s maturity, we therefore see round sizes increase. Investors are willing to give companies more money as their investments are de-risked, and companies are more willing to take it as it represents less dilution.
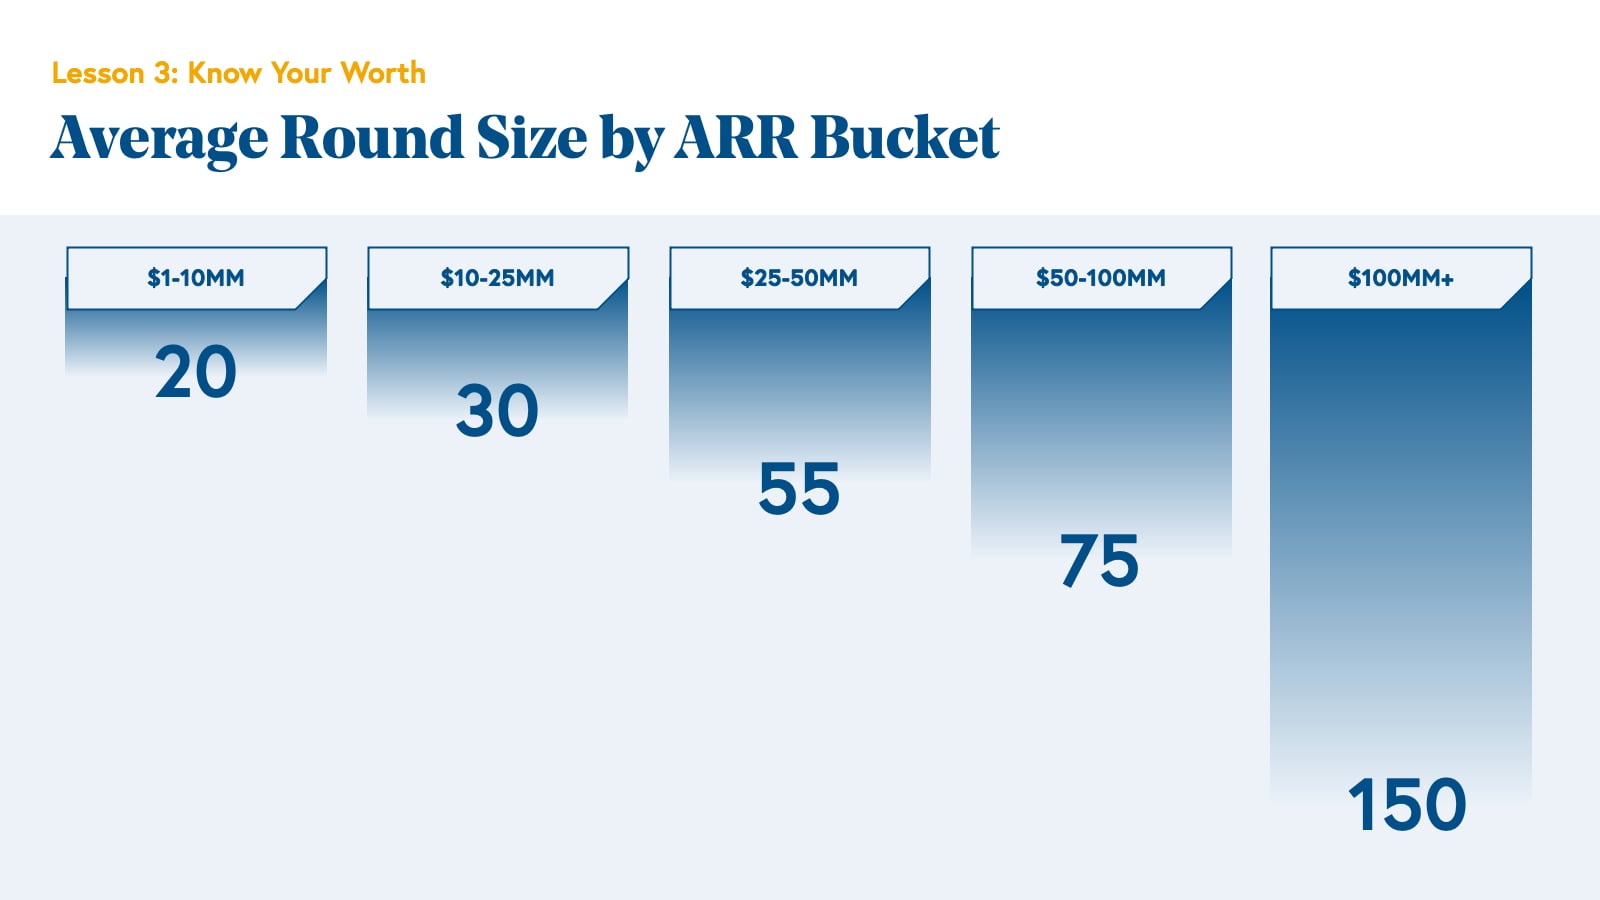
Looking at the data validates this trend: As companies generate more revenue, their round sizes go up. The average round size for a Bessemer cloud company from $0-10MM of ARR is $20MM, but by the time a company is $50-100MM of ARR, the average round size is north of $75MM. Interestingly, even though the ARR buckets go up non-linearly, the round sizes go up linearly. That means larger companies are not raising larger rounds proportional to the size of their ARR. While this data extends over the past decade of Bessemer’s cloud investments, many have noted the recent increase in round sizes in 2020 and 2021 that exceed even the averages below.
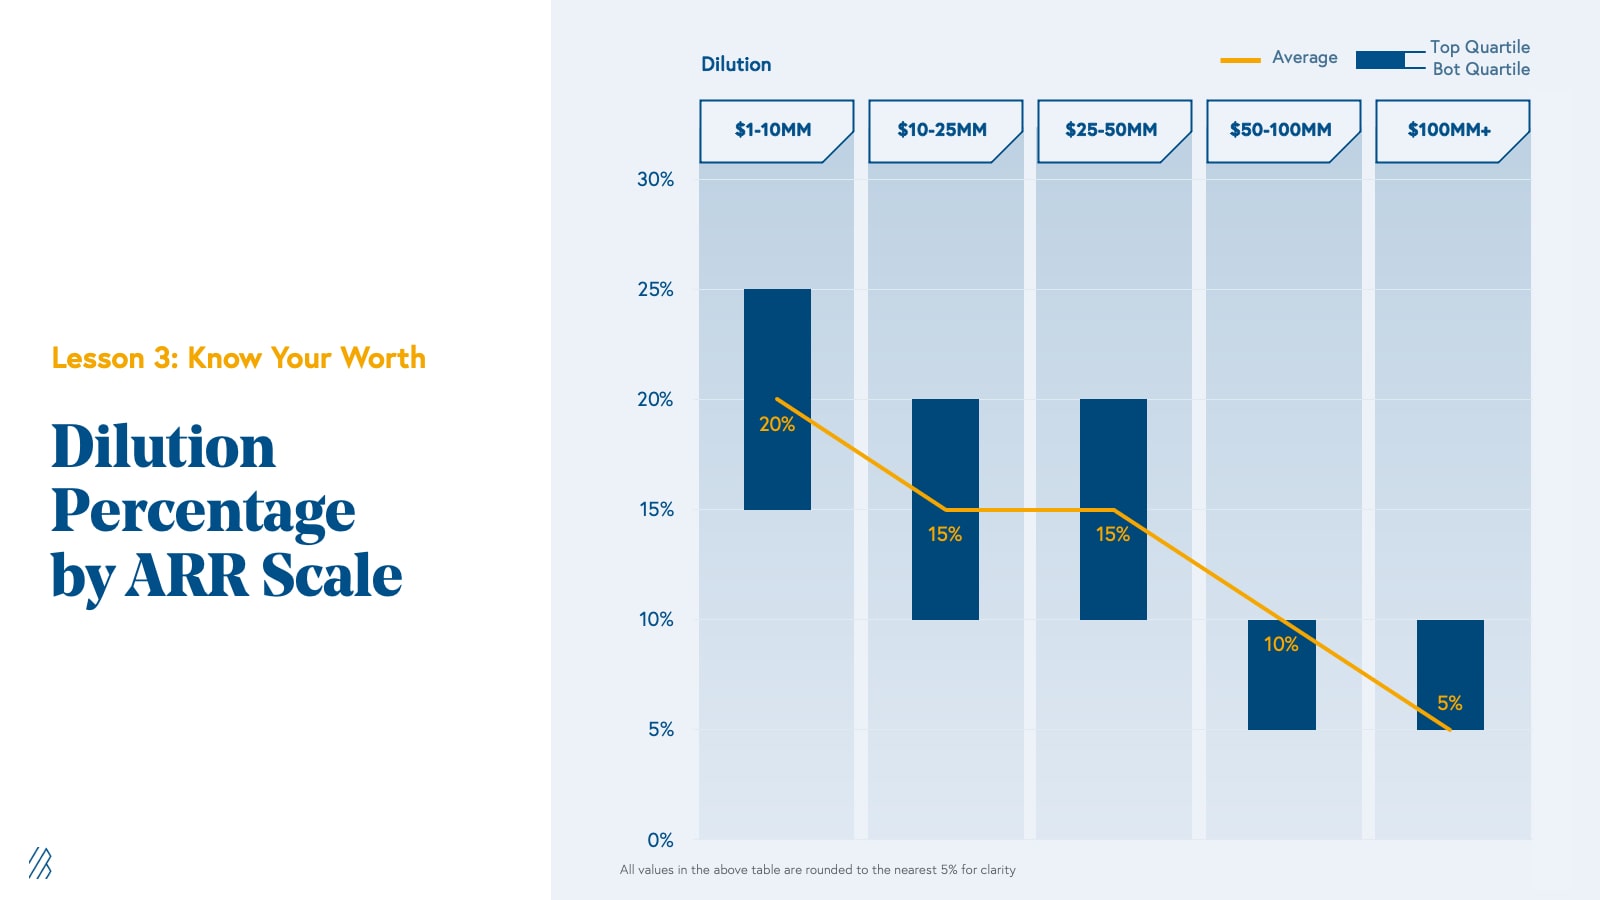
As companies mature and their valuations grow, they understandably have to sell less of their businesses for the same quantum of capital—price per share goes up. As a consequence, we see the dilution that founders take decreases with scale. From $1-10MM of ARR (which roughly translates to Series A or B), companies generally sold about 20% of their businesses, but by $100MM (roughly Series E or F), they sold only a bit more than 5%.
Lesson 4: The TL;DR — plot your way to the next milestone
Building a business is not for the faint of heart—the founder’s journey is fraught with both professional and emotional highs and lows, as we’ve seen firsthand from dozens of category-defining companies, such as Toast, Shopify, Twilio, Procore, and PagerDuty. We are open sourcing this proprietary data with the hopes that these benchmarks serve as a reference point for founders who are shaping their businesses and want to know what they should be driving towards.
In the following sections, we lay out the exact metrics founders, CEOs, CFOs, and board members should track, based on our research and experiences in the Bessemer portfolio over the past decade. While the work to achieve these milestones may still be ahead, we hope we’ve painted a picture of the goals cloud companies should strive for.
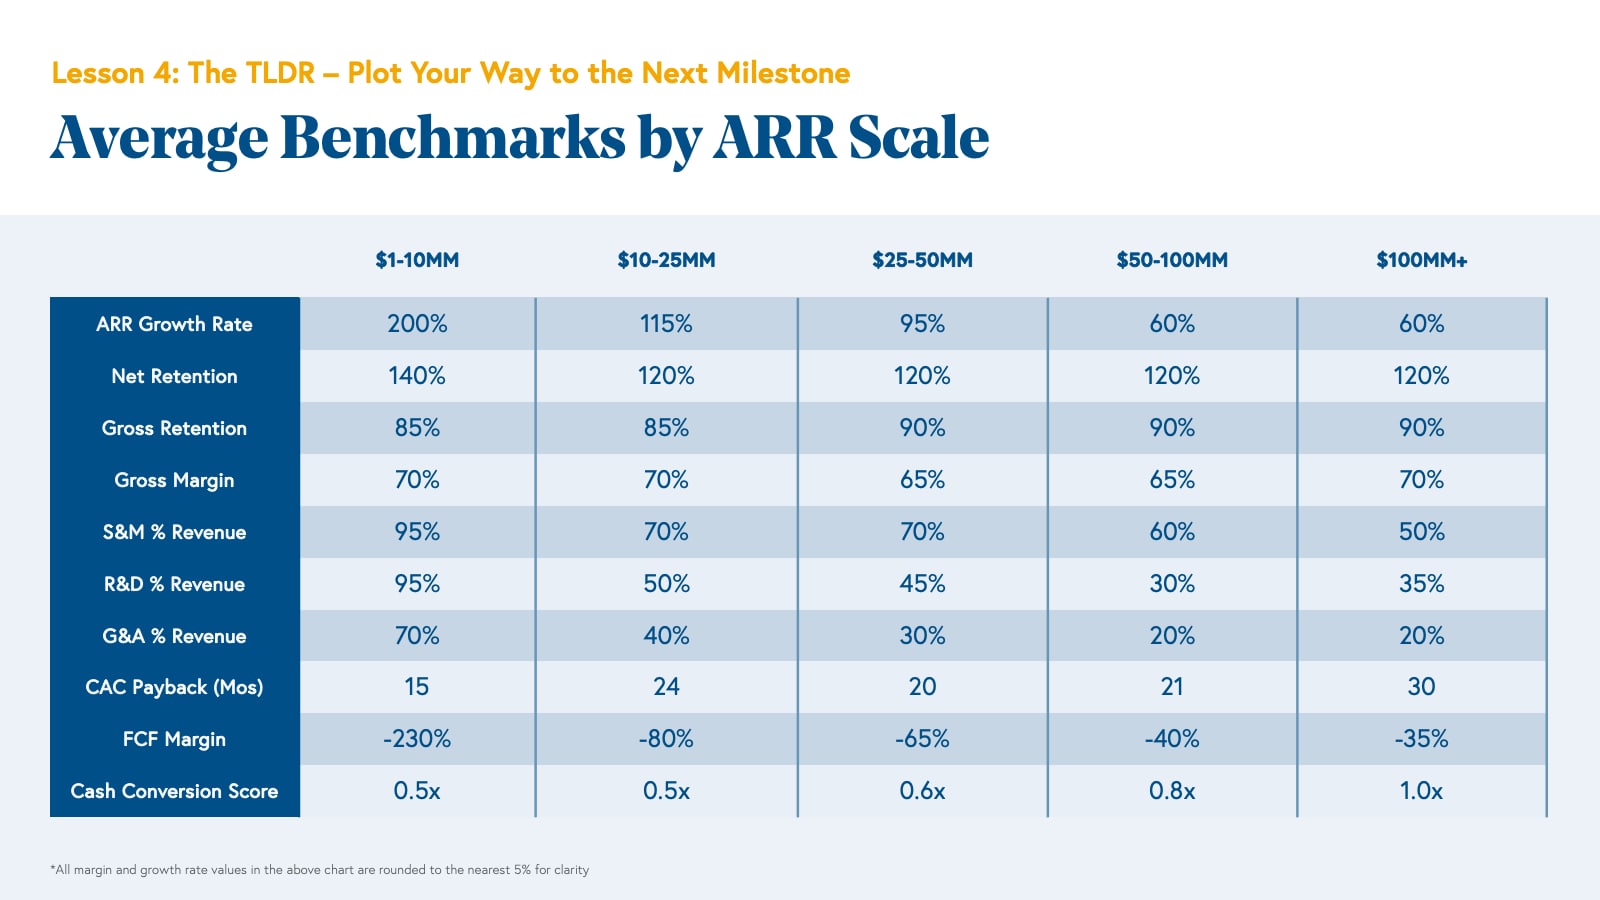
Average benchmarks by ARR scale
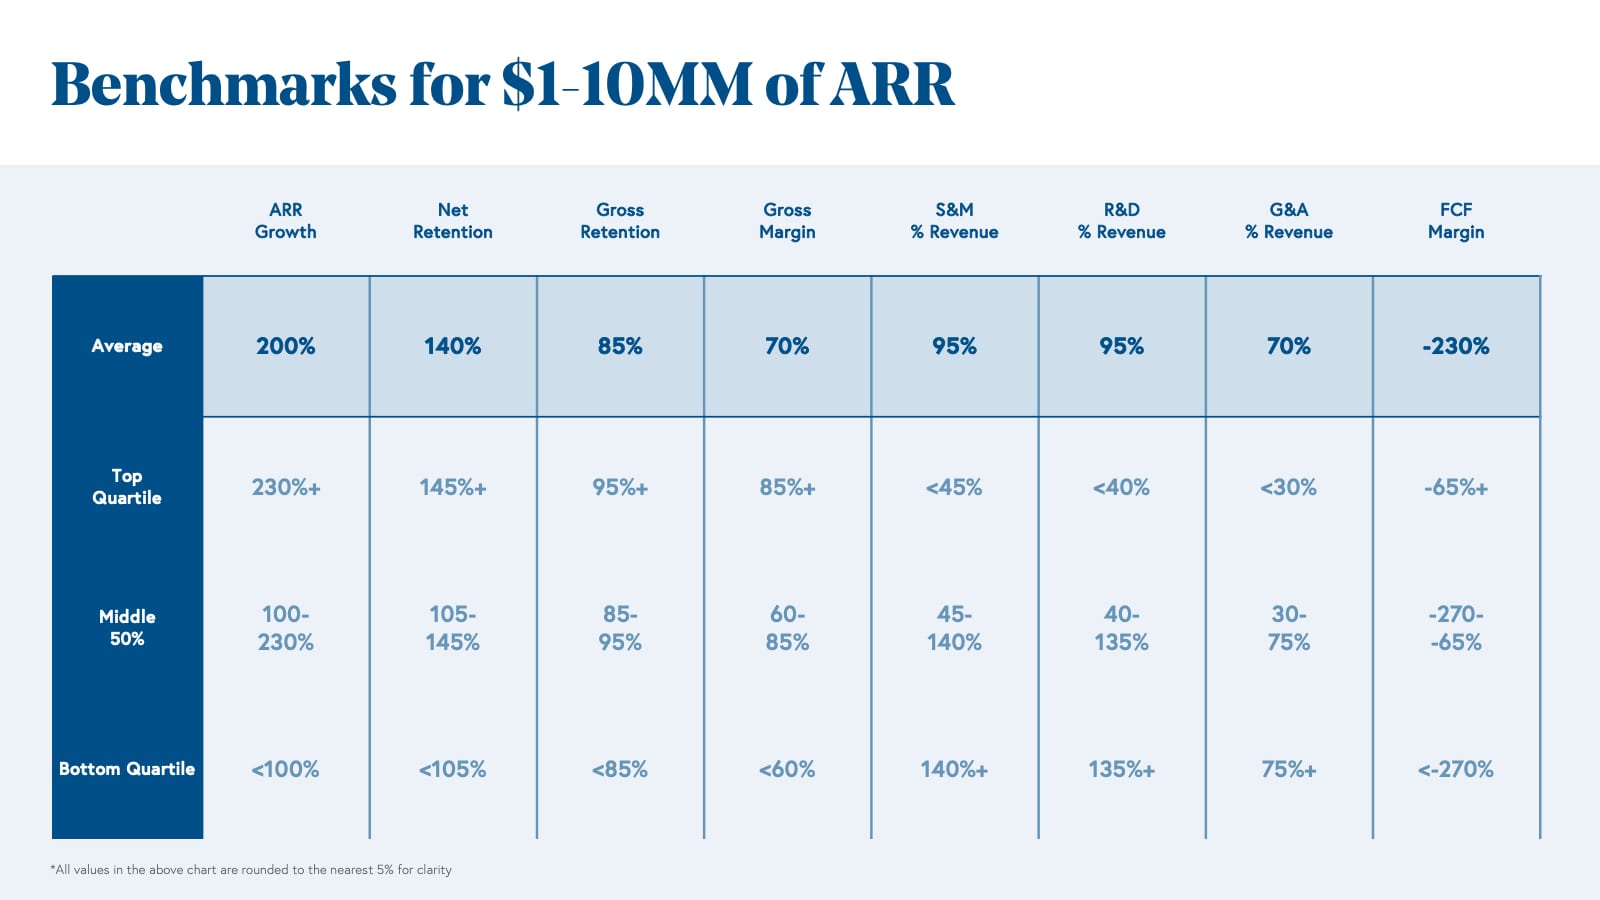
Benchmarks for companies with $1-10MM of ARR
Top-performing cloud companies with $1 to $10MM of ARR have ARR growth rates of 230%+, Net Retentions of 145%+, Gross Margins of 85%+, and FCF margins of -65%+.
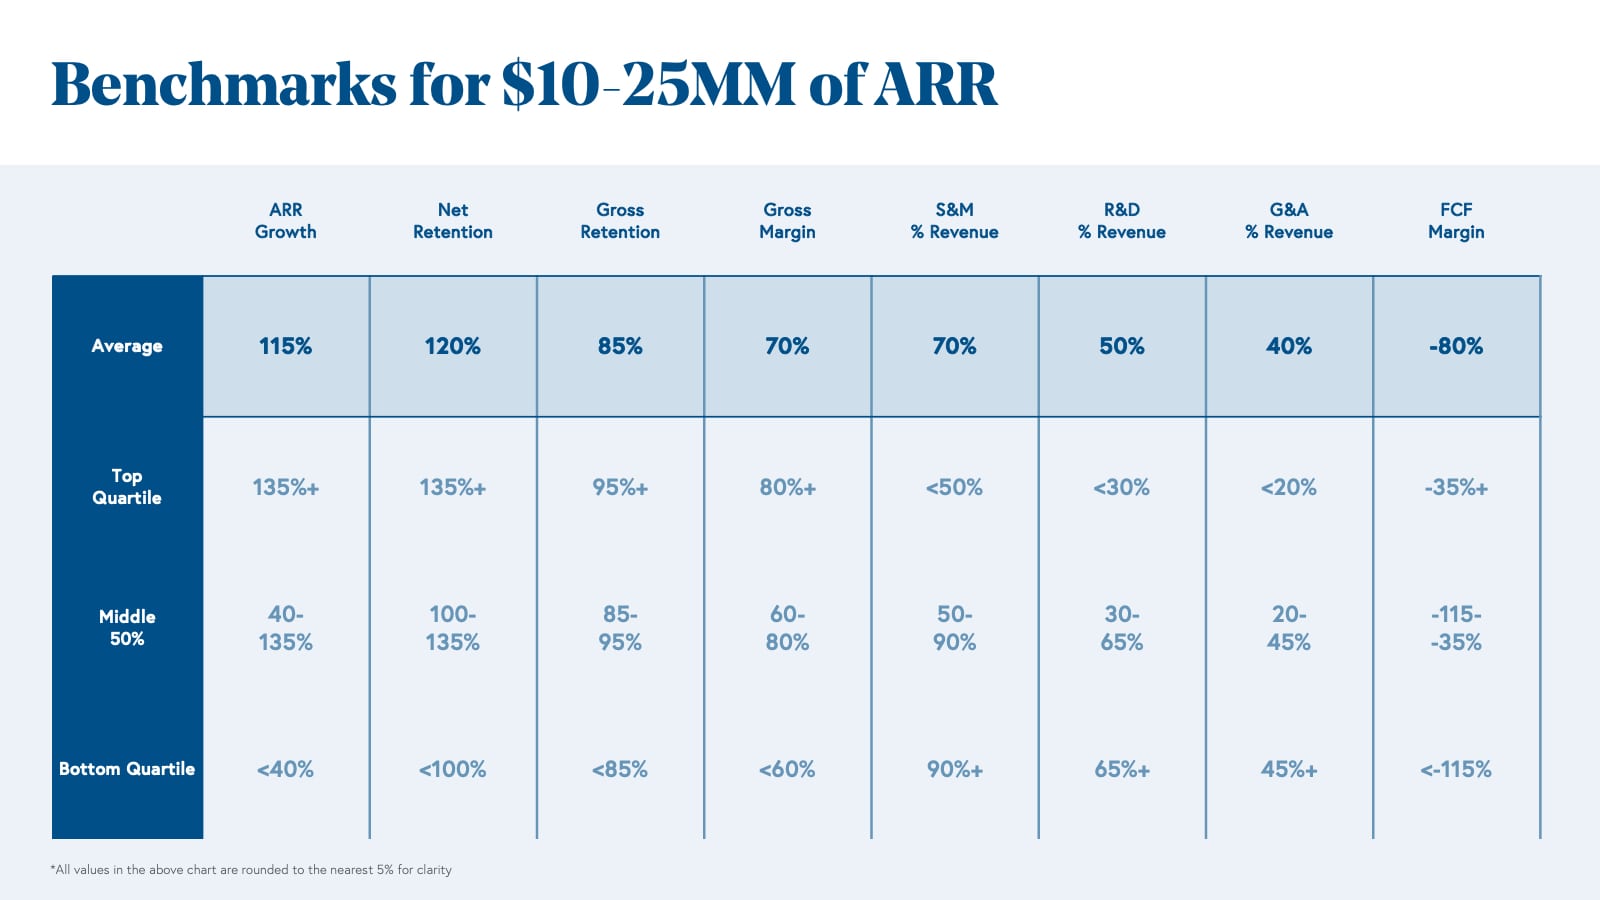
Benchmarks for companies with $10-25MM of ARR
Top-performing cloud companies with $10MM to $25MM of ARR have ARR growth rates of 135%+, Net Retentions of 135%+, Gross Margins of 80%, and FCF margins of -35%+.
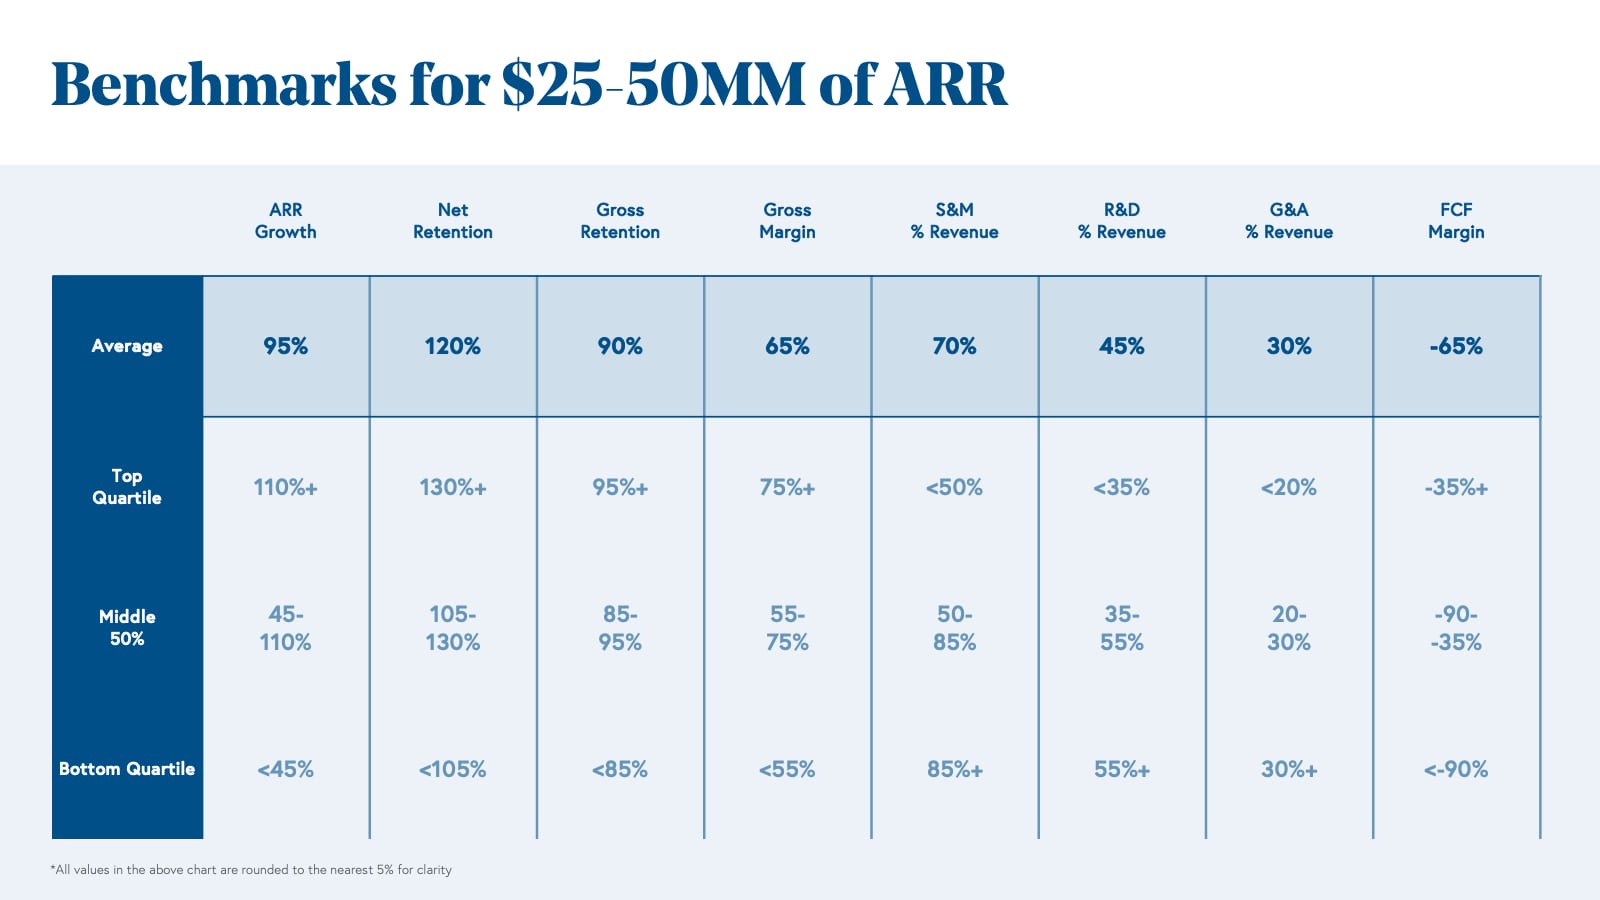
Benchmarks for companies with $25-50MM of ARR
Top-performing cloud companies with $25MM to $50MM of ARR have ARR growth rates of 110%+, Net Retentions of 130%+, Gross Margins of 75%+, and FCF margins of -35%+.
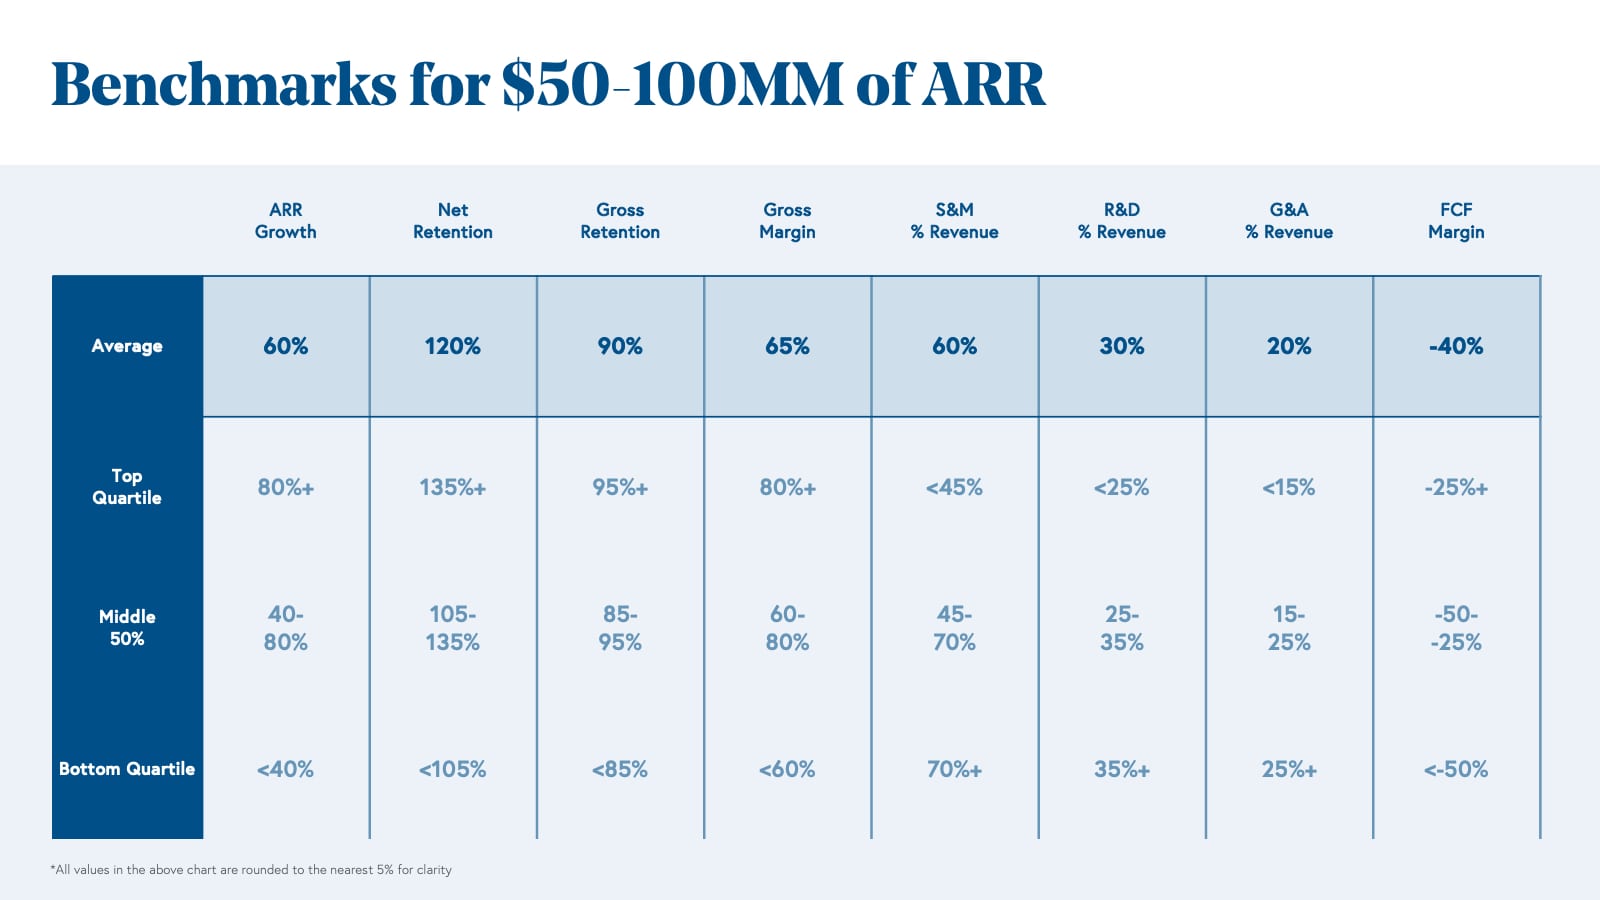
Benchmarks for companies with $50-100MM of ARR
Top-performing cloud companies with $50MM to $100MM of ARR have ARR growth rates of 80%+, Net Retentions of 135%+, Gross Margins of 80%+, and FCF margins of -25%+.
Benchmarks for companies growing beyond $100MM of ARR
Top-performing cloud companies growing beyond $100MM of ARR have ARR growth rates of 80%+, Net Retentions of 125%+, Gross Margins of 80%+, and FCF margins of -20%+.
Bonus Lesson 5: Beyond $100MM — run the Public Playbook
So what happens after $100MM? Just as we offered the Public Playbook as a Bonus lesson in our 10 Laws of Cloud, we offer it again here.
As you build a cloud company, we bet you hope that it will go public one day. As investors at Bessemer, whether we're making an early-stage Series A bet or a late-stage Series D investment, we partner with founders who have long-term visions, and to go the distance generally requires becoming a publicly traded company. M&A outcomes will happen along the way as companies develop strategic positions in the market and build features that could add to acquirers’ product portfolios, but we invest in companies believing that they can and will turn into the platforms that can be standalone public companies. You probably are building your company to change the world and dream of ringing the NYSE or Nasdaq bell.
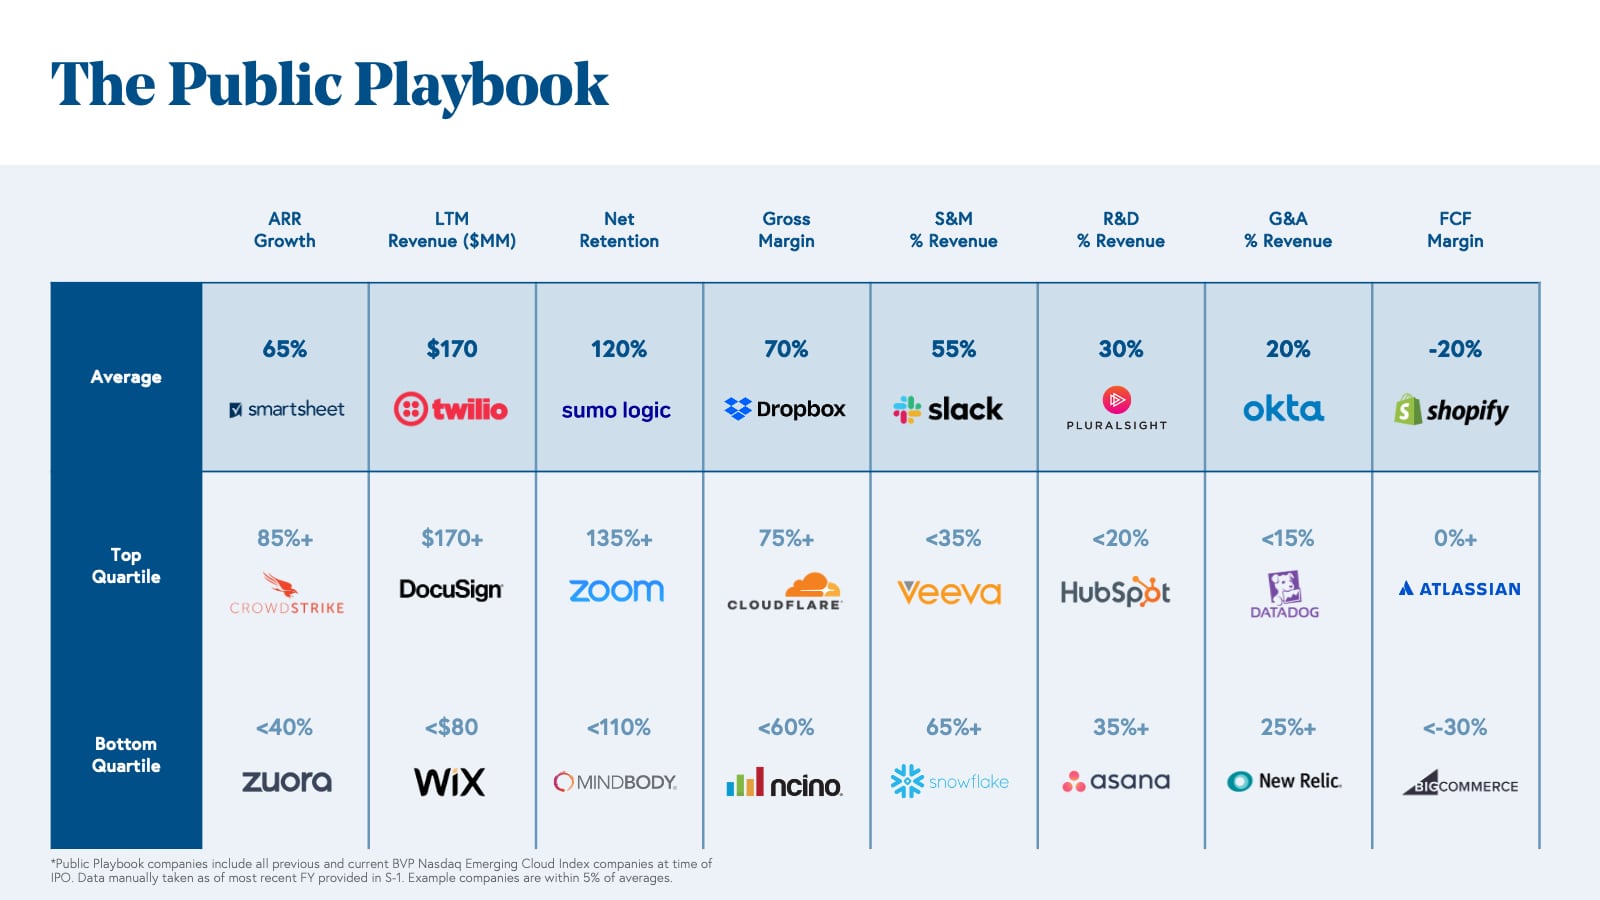
So how do you get there? What is beyond $100MM of ARR? We put together the same benchmarks that we tracked above for the past decade of Bessemer’s private cloud software companies for Bessemer’s public cloud index companies, tracked by the BVP Nasdaq Emerging Cloud Index.** These are the metrics that Toast, Amplitude, and Freshworks worked toward as they prepared for their IPOs.
Very consistent with what we noted in the $100MM+ ARR buckets in the sections above, we find that at IPO, the average LTM revenue growth rate is 65%, net retention is 120%, gross margin is 70%, R&D % of revenue is 30%, S&M % of revenue is 55%, G&A % of revenue is 20%, and FCF margin is -20%.
What is new, however, is that to run the public playbook, you need enough GAAP LTM revenue. The average LTM GAAP revenue that cloud companies had in their last fiscal year before going public was $170MM. This number has ranged widely, from Ellie Mae with <$50MM of revenue when it went public in 2011 to Square with over $850MM in its last fiscal year before becoming a public company, but the 2020/2021 cohort average is even higher at $220MM. While there is no “magic number,” we recommend targeting $100MM+, which signals to public market investors a company maturity that will allow it to stand the test of time and a high enough market cap to warrant investor interest and attention. Note that per their preliminary IPO prospectuses, Freshworks has generated $308MM of LTM revenue, Toast $1.1 billion, and Amplitude $129MM.
To run the public playbook, you also have to understand that while the private markets generally expect a lot of up front investment and growth, the public markets tend to expect enough maturity that companies have visibility into operating leverage and profitability. We recommend that cloud companies only target going public when they have visibility into being free cash flow positive within about 1-2 years. The top quartile of cloud companies were actually already at FCF breakeven or positivity at IPO, and these companies include the likes of Atlassian, JFrog, and Zoom.
Running the public playbook and targeting these metrics will take you beyond $100MM ARR and to life as a public company!
Show us your metrics
Are you about to raise your next round of financing as a venture-backed cloud startup? Download our templates so you can show us where your company lands as you scale your cloud business to $100 million in ARR and beyond, or use them in your boardroom as you track your business’ growth.
Download Your Bessemer Benchmarks
Median benchmarks by ARR scale
|
ARR Scale |
ARR Growth Rate |
Net Retention |
Gross Margin |
FCF Margin |
|
$1-10MM |
165% |
125% |
72% |
-167% |
|
$10-25MM |
87% |
117% |
70% |
-75% |
|
$25-50MM |
77% |
120% |
65% |
-62% |
|
$50-100MM |
60% |
120% |
70% |
-37%+ |
|
$100MM+ |
57% |
115% |
70% |
-35%+ |
If you have any questions, would like to dive deeper into the metrics, or have a company that has best-in-class metrics, we would love to hear from you!
*The data you see in the report is based on financial information from Bessemer’s cloud portfolio from 2010-1H21; it is not a random sample of the entire private market.
**Any company that is currently or has ever been on the index.